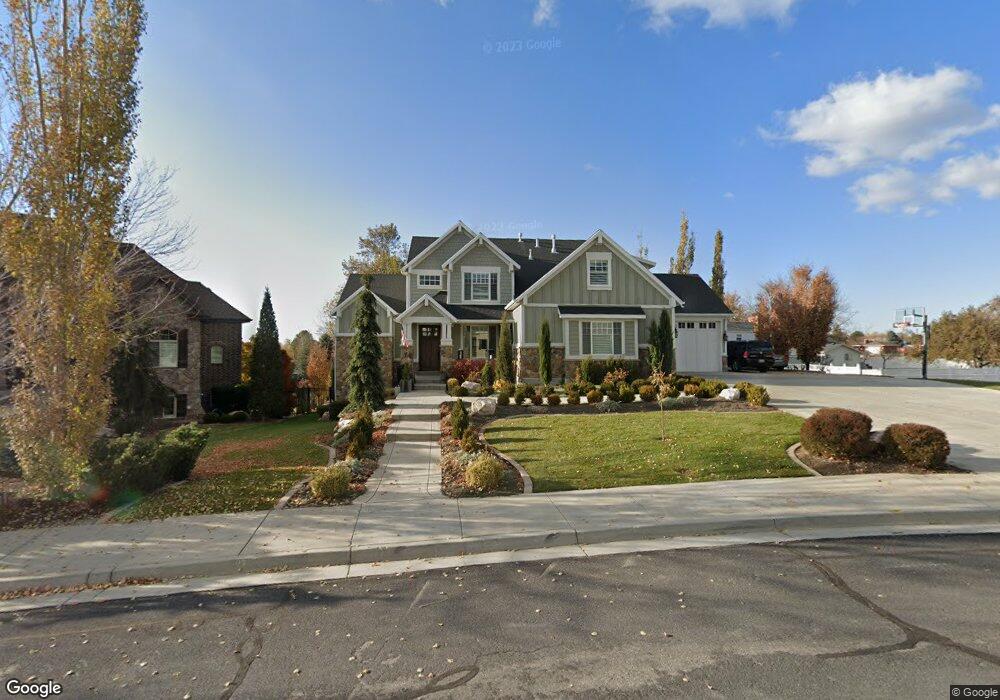
893 E Fence Post Rd Unit 204 Fruit Heights, UT 84037
Estimated Value: $1,432,000 - $1,963,690
--
Bed
4
Baths
2,691
Sq Ft
$641/Sq Ft
Est. Value
About This Home
This home is located at 893 E Fence Post Rd Unit 204, Fruit Heights, UT 84037 and is currently estimated at $1,723,897, approximately $640 per square foot. 893 E Fence Post Rd Unit 204 is a home located in Davis County with nearby schools including H.C. Burton Elementary School, Kaysville Junior High School, and Davis High School.
Ownership History
Date
Name
Owned For
Owner Type
Purchase Details
Closed on
Jan 15, 2020
Sold by
Nixon Tyler Mark
Bought by
Nixon Tyler Mark and Nixon Emily B
Current Estimated Value
Home Financials for this Owner
Home Financials are based on the most recent Mortgage that was taken out on this home.
Original Mortgage
$770,935
Outstanding Balance
$681,152
Interest Rate
3.6%
Mortgage Type
VA
Estimated Equity
$1,042,745
Purchase Details
Closed on
Jul 27, 2018
Sold by
Nixon Tyler Mark
Bought by
Nixon Tyler Mark and Nixon Emily B
Home Financials for this Owner
Home Financials are based on the most recent Mortgage that was taken out on this home.
Original Mortgage
$779,144
Interest Rate
4.5%
Mortgage Type
VA
Purchase Details
Closed on
Jun 12, 2007
Sold by
Fox Creek Llc
Bought by
Winquist Cameron and Winquist Natalie
Create a Home Valuation Report for This Property
The Home Valuation Report is an in-depth analysis detailing your home's value as well as a comparison with similar homes in the area
Home Values in the Area
Average Home Value in this Area
Purchase History
| Date | Buyer | Sale Price | Title Company |
|---|---|---|---|
| Nixon Tyler Mark | -- | Us Title Company Of Ut | |
| Nixon Tyler Mark | -- | Us Title Company Of U | |
| Nixon Tyler Mark | -- | North American Title | |
| Nixon Tyler Mark | -- | Aspen Title | |
| Winquist Cameron | -- | Heritage West Title Ins Agen |
Source: Public Records
Mortgage History
| Date | Status | Borrower | Loan Amount |
|---|---|---|---|
| Open | Nixon Tyler Mark | $770,935 | |
| Closed | Nixon Tyler Mark | $779,144 |
Source: Public Records
Tax History Compared to Growth
Tax History
| Year | Tax Paid | Tax Assessment Tax Assessment Total Assessment is a certain percentage of the fair market value that is determined by local assessors to be the total taxable value of land and additions on the property. | Land | Improvement |
|---|---|---|---|---|
| 2024 | $9,942 | $1,018,600 | $255,444 | $763,156 |
| 2023 | $8,621 | $1,601,000 | $394,007 | $1,206,993 |
| 2022 | $8,436 | $855,251 | $201,977 | $653,274 |
| 2021 | $6,573 | $1,007,000 | $313,349 | $693,651 |
| 2020 | $6,786 | $1,007,000 | $267,610 | $739,390 |
| 2019 | $6,305 | $924,000 | $288,502 | $635,498 |
| 2018 | $5,918 | $855,000 | $233,965 | $621,035 |
| 2016 | $4,832 | $363,656 | $124,840 | $238,816 |
| 2015 | $4,665 | $333,905 | $124,840 | $209,065 |
| 2014 | $5,716 | $433,520 | $124,840 | $308,680 |
| 2013 | -- | $133,390 | $133,390 | $0 |
Source: Public Records
Map
Nearby Homes
- 947 E Green Rd
- 617 E Whisper Creek Dr
- 673 S Main St
- 481 E Laurelwood Dr S
- 1351 E 400 S
- 557 E Warm Springs Dr
- 1043 S Oxford Cir
- 558 E Center St
- 1206 E 986 S Unit 31
- 1145 Creek View Dr
- 636 E 100 N
- 998 E Country Rd
- 399 Stirling Dr E
- 1236 E 100 S
- 960 E Par Three Cir
- 1419 E Heights Way Unit 15
- 362 Glen Cir
- 309 E 100 S
- 331 E 100 S
- 118 E 600 S
- 893 E Fence Post Rd Unit 204
- 893 E Fence Post Rd
- 891 E Fence Post Rd
- 467 S 875 E
- 459 S 875 E
- 481 S 875 E
- 897 E Fence Post Rd Unit 203
- 889 E Fence Post Rd
- 894 E Fence Post Rd Unit 211
- 894 E Fence Post Rd
- 503 S 875 E
- 892 E 450 S
- 898 E Fence Post Rd
- 898 E Fence Post Rd
- 901 E Fence Post Rd
- 901 Fence Post Rd
- 464 S 875 E
- 535 S 875 E
- 535 S 875 E Unit 3
- 902 E 450 S