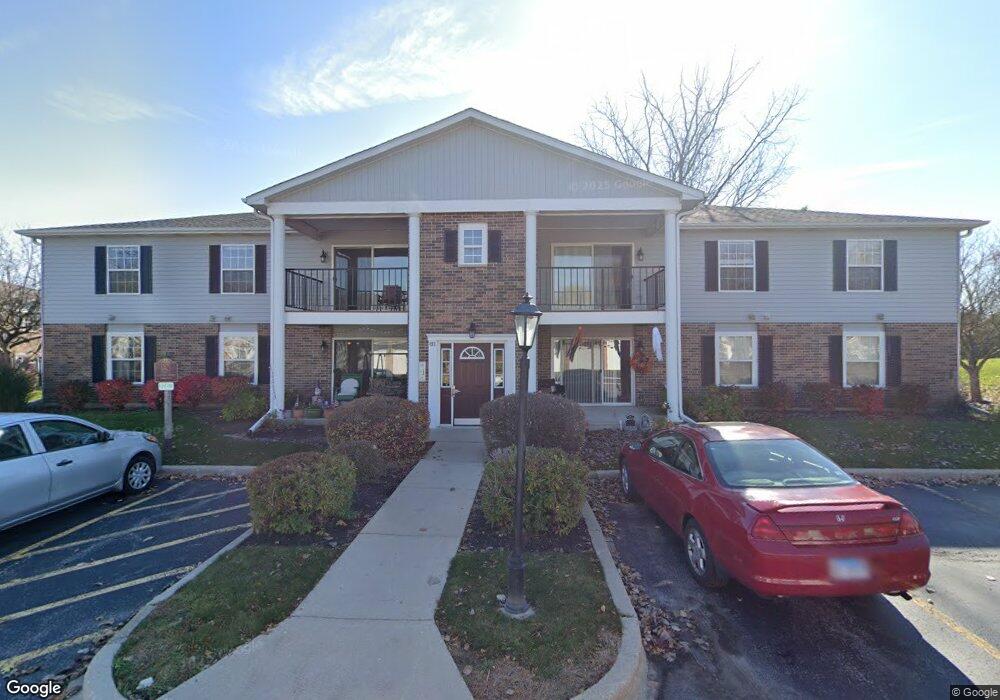
893 Golf Course Rd Crystal Lake, IL 60014
Estimated Value: $138,000 - $203,000
2
Beds
1
Bath
1,007
Sq Ft
$176/Sq Ft
Est. Value
About This Home
This home is located at 893 Golf Course Rd, Crystal Lake, IL 60014 and is currently estimated at $177,547, approximately $176 per square foot. 893 Golf Course Rd is a home located in McHenry County with nearby schools including South Elementary School, Lundahl Middle School, and Crystal Lake South High School.
Ownership History
Date
Name
Owned For
Owner Type
Purchase Details
Closed on
Jan 31, 2020
Sold by
Dab Investments Llc
Bought by
Benton Derek A
Current Estimated Value
Home Financials for this Owner
Home Financials are based on the most recent Mortgage that was taken out on this home.
Original Mortgage
$70,000
Outstanding Balance
$48,822
Interest Rate
4.12%
Mortgage Type
New Conventional
Estimated Equity
$128,725
Purchase Details
Closed on
Jan 4, 2018
Sold by
Benton Derek
Bought by
Dab Investments Llc
Purchase Details
Closed on
Oct 31, 2006
Sold by
Crystal Real Estate Partners Llc
Bought by
Benton Derek A
Home Financials for this Owner
Home Financials are based on the most recent Mortgage that was taken out on this home.
Original Mortgage
$112,800
Interest Rate
6.45%
Mortgage Type
Purchase Money Mortgage
Create a Home Valuation Report for This Property
The Home Valuation Report is an in-depth analysis detailing your home's value as well as a comparison with similar homes in the area
Home Values in the Area
Average Home Value in this Area
Purchase History
| Date | Buyer | Sale Price | Title Company |
|---|---|---|---|
| Benton Derek A | -- | Chicago Title | |
| Dab Investments Llc | -- | None Available | |
| Benton Derek A | $141,100 | Heritage Title Company |
Source: Public Records
Mortgage History
| Date | Status | Borrower | Loan Amount |
|---|---|---|---|
| Open | Benton Derek A | $70,000 | |
| Previous Owner | Benton Derek A | $112,800 |
Source: Public Records
Tax History Compared to Growth
Tax History
| Year | Tax Paid | Tax Assessment Tax Assessment Total Assessment is a certain percentage of the fair market value that is determined by local assessors to be the total taxable value of land and additions on the property. | Land | Improvement |
|---|---|---|---|---|
| 2024 | $4,452 | $52,585 | $12,834 | $39,751 |
| 2023 | $4,330 | $47,030 | $11,478 | $35,552 |
| 2022 | $3,528 | $37,244 | $10,359 | $26,885 |
| 2021 | $3,351 | $34,698 | $9,651 | $25,047 |
| 2020 | $3,274 | $33,469 | $9,309 | $24,160 |
| 2019 | $3,198 | $32,034 | $8,910 | $23,124 |
| 2018 | $2,891 | $28,390 | $8,231 | $20,159 |
| 2017 | $2,887 | $26,745 | $7,754 | $18,991 |
| 2016 | $2,829 | $25,085 | $7,273 | $17,812 |
| 2013 | -- | $20,117 | $6,784 | $13,333 |
Source: Public Records
Map
Nearby Homes
- 804 Chasefield Ln Unit 3
- 1009 Sutton Dr
- 679 Barlina Rd
- 740 Saint Andrews Ln Unit 21
- 796 Waterford Cut
- 633 Cress Creek Ln Unit 1
- 650 Cress Creek Ln Unit 1
- 542 Silver Aspen Cir
- 900 Sarasota Ln
- 1021 Abbey Dr
- 567 Cress Creek Ln
- 1041 Barlina Rd
- 1025 Wedgewood Dr
- 480 Westwood Ct Unit C
- 408 Buckingham Dr
- 812 Wedgewood Dr
- 1289 Westport Ridge
- 571 Nash Rd
- 1014 Stonehedge Ct Unit 8
- 293 Wellington Dr
- 893 Golf Course Rd
- 893 Golf Course Rd
- 893 Golf Course Rd
- 893 Golf Course Rd Unit 7
- 893 Golf Course Rd Unit 6
- 893 Golf Course Rd Unit 5
- 893 Golf Course Rd Unit 8932
- 893 Golf Course Rd Unit 8
- 893 Golf Course Rd Unit 2
- 893 Golf Course Rd Unit 1
- 893 Golf Course Rd Unit 4
- 929 Golf Course Rd Unit 1
- 929 Golf Course Rd Unit 8
- 929 Golf Course Rd
- 929 Golf Course Rd
- 929 Golf Course Rd
- 929 Golf Course Rd
- 929 Golf Course Rd
- 929 Golf Course Rd Unit 2
- 929 Golf Course Rd