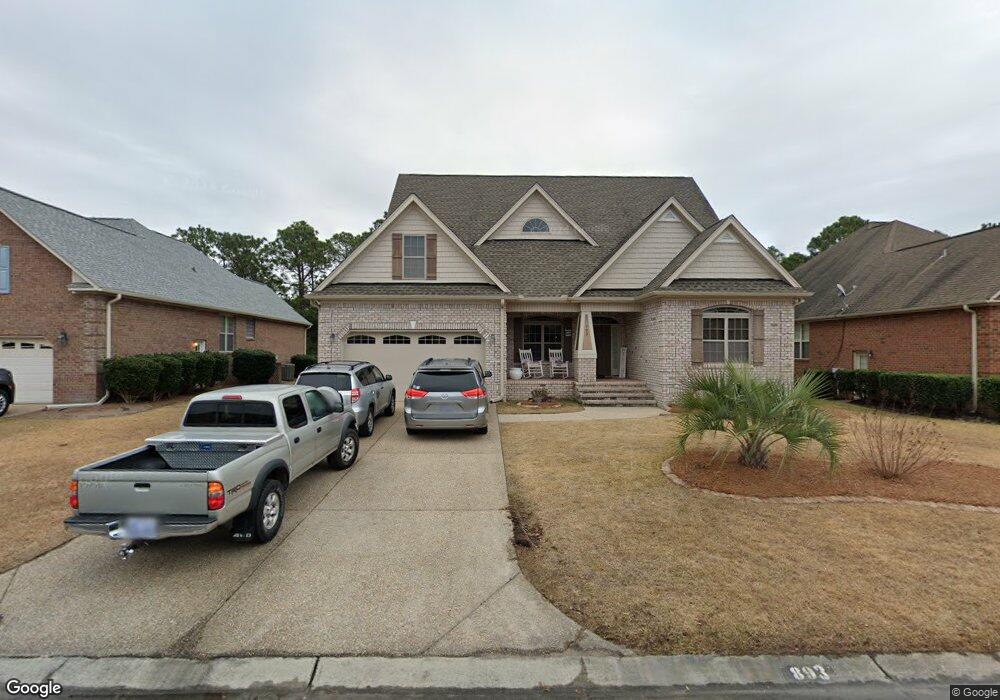
893 Highlands Dr Hampstead, NC 28443
Estimated Value: $476,000 - $521,000
--
Bed
--
Bath
2,926
Sq Ft
$173/Sq Ft
Est. Value
About This Home
This home is located at 893 Highlands Dr, Hampstead, NC 28443 and is currently estimated at $507,640, approximately $173 per square foot. 893 Highlands Dr is a home with nearby schools including South Topsail Elementary School, Topsail Middle School, and Topsail High School.
Ownership History
Date
Name
Owned For
Owner Type
Purchase Details
Closed on
Jan 8, 2025
Sold by
Reyes Joel
Bought by
Kings Holdings Incorporation
Current Estimated Value
Purchase Details
Closed on
Sep 25, 2019
Sold by
Garcia Catalina Gonzalez
Bought by
Reyes Fausto Joel
Purchase Details
Closed on
Jul 11, 2017
Sold by
International Properties And Investments
Bought by
Garcia Catalina Gonzalez
Purchase Details
Closed on
Apr 11, 2016
Sold by
Reyes Fausto Joel
Bought by
International Properties & Investments L
Purchase Details
Closed on
Nov 5, 2013
Sold by
Carbone Anthony and Carbone Arline M
Bought by
Hansen Gene and Hansen Carole
Home Financials for this Owner
Home Financials are based on the most recent Mortgage that was taken out on this home.
Original Mortgage
$28,125
Interest Rate
4.23%
Mortgage Type
Future Advance Clause Open End Mortgage
Create a Home Valuation Report for This Property
The Home Valuation Report is an in-depth analysis detailing your home's value as well as a comparison with similar homes in the area
Home Values in the Area
Average Home Value in this Area
Purchase History
| Date | Buyer | Sale Price | Title Company |
|---|---|---|---|
| Kings Holdings Incorporation | -- | None Listed On Document | |
| Kings Holdings Incorporation | -- | None Listed On Document | |
| Reyes Fausto Joel | -- | None Available | |
| Garcia Catalina Gonzalez | -- | None Available | |
| International Properties & Investments L | -- | None Available | |
| Hansen Gene | $38,000 | None Available |
Source: Public Records
Mortgage History
| Date | Status | Borrower | Loan Amount |
|---|---|---|---|
| Previous Owner | Hansen Gene | $28,125 |
Source: Public Records
Tax History Compared to Growth
Tax History
| Year | Tax Paid | Tax Assessment Tax Assessment Total Assessment is a certain percentage of the fair market value that is determined by local assessors to be the total taxable value of land and additions on the property. | Land | Improvement |
|---|---|---|---|---|
| 2024 | $2,921 | $294,161 | $60,865 | $233,296 |
| 2023 | $2,921 | $294,161 | $60,865 | $233,296 |
| 2022 | $2,559 | $294,161 | $60,865 | $233,296 |
| 2021 | $2,559 | $294,161 | $60,865 | $233,296 |
| 2020 | $2,669 | $294,161 | $60,865 | $233,296 |
| 2019 | $2,559 | $294,161 | $60,865 | $233,296 |
| 2018 | $2,960 | $314,097 | $60,000 | $254,097 |
| 2017 | $2,960 | $314,097 | $60,000 | $254,097 |
| 2016 | $431 | $50,000 | $50,000 | $0 |
| 2015 | -- | $50,000 | $50,000 | $0 |
| 2014 | $335 | $50,000 | $50,000 | $0 |
| 2013 | -- | $50,000 | $50,000 | $0 |
| 2012 | -- | $50,000 | $50,000 | $0 |
Source: Public Records
Map
Nearby Homes
- 41 Windsor Ct
- 607 Castle Bay Dr
- 397 Highlands Dr
- 100 Scotlands Ct
- 35 Scotlands Ct
- 82 Highlands Dr
- 609 & 633 Saint Johns Church Rd
- 32 W Pioneer Way Unit 128
- 17 E Pioneer Way Unit 151
- 426 Canter Crest Rd
- 58 Draft Line Ct
- 18 E Pioneer Way Unit 74
- 8 E Pioneer Way Unit 75
- 26 E Pioneer Way Unit 73
- 34 E Pioneer Way Unit 72
- 16 W Farley Dr Unit 101
- 20 W Farley Dr Unit 100
- 9 E Farley Dr Unit 71
- 34 W Farley Dr Unit 97
- 38 W Farley Dr Unit 96
- 875 Highlands Dr
- 909 Highlands Dr
- 921 Highlands Dr
- 857 Highlands Dr
- 894 Highlands Dr
- 880 Highlands Dr
- 914 Highlands Dr
- 847 Highlands Dr
- 872 Highlands Dr
- 931 Highlands Dr
- 860 Highlands Dr
- 940 Highlands Dr
- 833 Highlands Dr
- 941 Highlands Dr
- 844 Highlands Dr
- 956 Highlands Dr
- 817 Highlands Dr
- 963 Highlands Dr
- 826 Highlands Dr
- 803 Highlands Dr