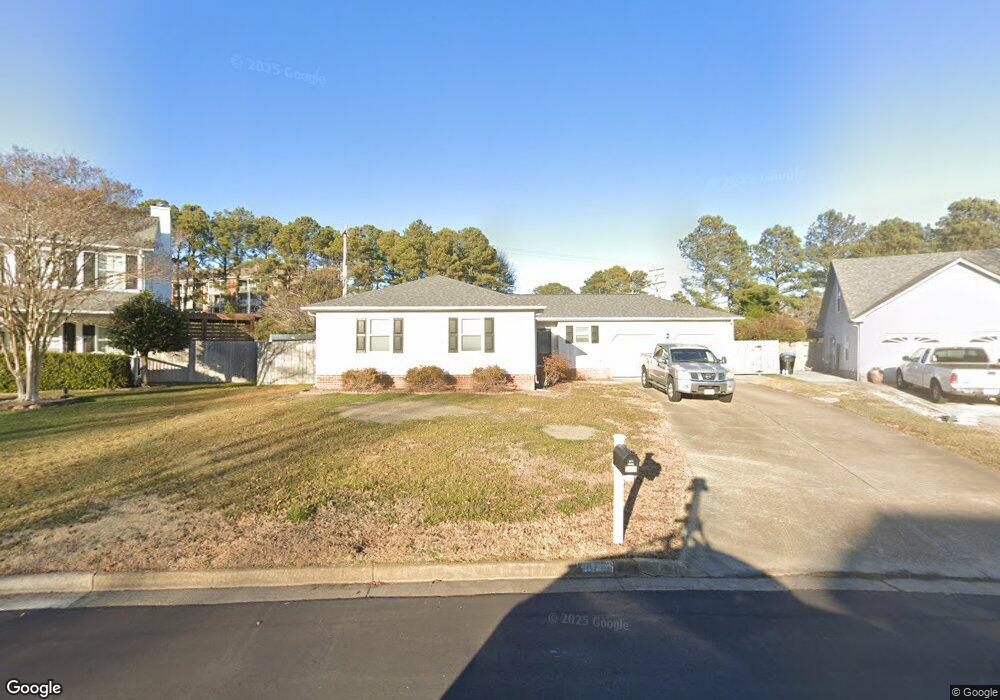
893 Levy Loop Virginia Beach, VA 23454
Virginia Beach Central NeighborhoodEstimated Value: $403,000 - $456,000
3
Beds
2
Baths
1,455
Sq Ft
$302/Sq Ft
Est. Value
About This Home
This home is located at 893 Levy Loop, Virginia Beach, VA 23454 and is currently estimated at $440,101, approximately $302 per square foot. 893 Levy Loop is a home located in Virginia Beach City with nearby schools including Ocean Lakes Elementary School, Corporate Landing Middle School, and Ocean Lakes High School.
Ownership History
Date
Name
Owned For
Owner Type
Purchase Details
Closed on
Jun 3, 2020
Sold by
Teets Cheryl L and Jones Cheryl L
Bought by
Bagwell Clinton E
Current Estimated Value
Home Financials for this Owner
Home Financials are based on the most recent Mortgage that was taken out on this home.
Original Mortgage
$284,905
Outstanding Balance
$253,017
Interest Rate
3.3%
Mortgage Type
New Conventional
Estimated Equity
$187,084
Create a Home Valuation Report for This Property
The Home Valuation Report is an in-depth analysis detailing your home's value as well as a comparison with similar homes in the area
Home Values in the Area
Average Home Value in this Area
Purchase History
| Date | Buyer | Sale Price | Title Company |
|---|---|---|---|
| Bagwell Clinton E | $299,900 | Priority Title & Escrow |
Source: Public Records
Mortgage History
| Date | Status | Borrower | Loan Amount |
|---|---|---|---|
| Open | Bagwell Clinton E | $284,905 |
Source: Public Records
Tax History
| Year | Tax Paid | Tax Assessment Tax Assessment Total Assessment is a certain percentage of the fair market value that is determined by local assessors to be the total taxable value of land and additions on the property. | Land | Improvement |
|---|---|---|---|---|
| 2025 | $3,638 | $386,400 | $176,000 | $210,400 |
| 2024 | $3,638 | $375,100 | $160,500 | $214,600 |
| 2023 | $3,500 | $353,500 | $150,000 | $203,500 |
| 2022 | $3,077 | $108,000 | $0 | $108,000 |
| 2021 | $4,724 | $283,600 | $115,000 | $168,600 |
| 2020 | $2,862 | $281,300 | $115,000 | $166,300 |
| 2019 | $2,717 | $257,400 | $108,000 | $149,400 |
| 2018 | $2,580 | $257,400 | $108,000 | $149,400 |
| 2017 | $2,516 | $251,000 | $108,000 | $143,000 |
| 2016 | $2,315 | $233,800 | $108,000 | $125,800 |
| 2015 | $2,299 | $232,200 | $117,800 | $114,400 |
| 2014 | $2,080 | $240,500 | $122,700 | $117,800 |
Source: Public Records
Map
Nearby Homes
- 1585 Bunsen Dr
- 1609 Solway Ct
- 797 Daimler Dr
- 635 Ocean Lakes Dr
- 1705 Ocean Bay Dr
- 941 Storm Lake Dr
- 1724 Cottenham Ln
- 1614 Sword Dancer Dr
- 1645 Cottenham Ln
- 1753 Pattington Cir
- 828 Maitland Dr
- 1025 Dam Neck Rd
- 1563 Sword Dancer Dr
- 854 Park Place Dr
- 776 Goodard Dr
- 1531 Sword Dancer Dr
- 1709 Kitimal Dr
- 1737 Sword Dancer Dr
- 1316 Narrow Way
- 1308 Narrow Way
Your Personal Tour Guide
Ask me questions while you tour the home.