Estimated Value: $140,601 - $203,000
3
Beds
2
Baths
1,232
Sq Ft
$136/Sq Ft
Est. Value
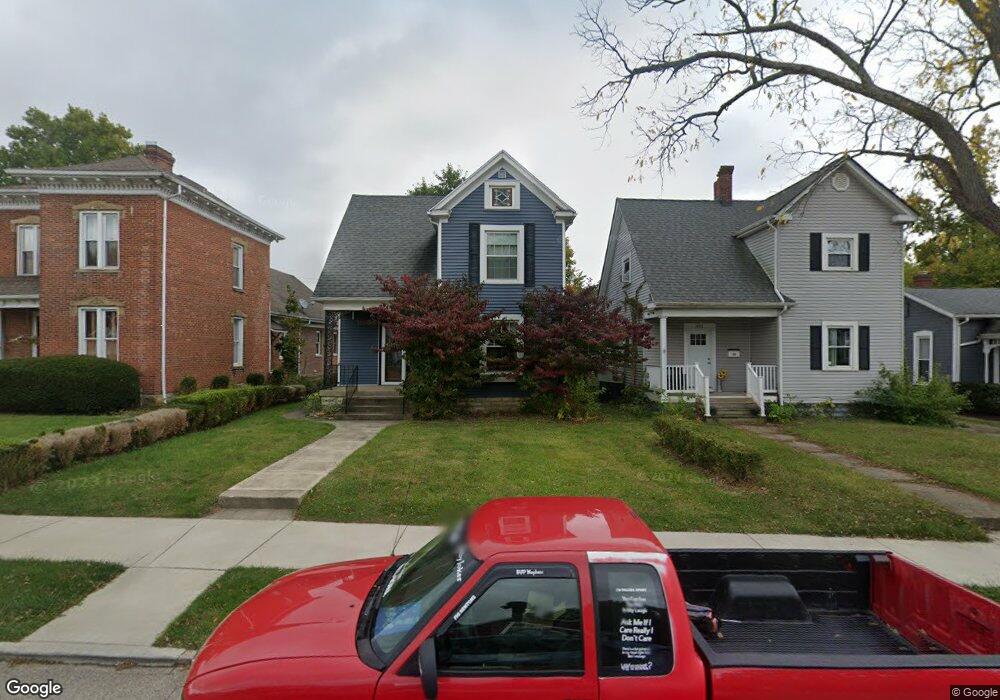
About This Home
This home is located at 893 S Detroit St, Xenia, OH 45385 and is currently estimated at $167,150, approximately $135 per square foot. 893 S Detroit St is a home located in Greene County with nearby schools including Xenia High School, Summit Academy Community School for Alternative Learners - Xenia, and Legacy Christian Academy.
Ownership History
Date
Name
Owned For
Owner Type
Purchase Details
Closed on
Jun 9, 2015
Sold by
Agiro Seth O and Agiro Christa P
Bought by
Cultice Wendell W and Cultice Rebecca M
Current Estimated Value
Purchase Details
Closed on
Sep 12, 2008
Sold by
Hud
Bought by
Agiro Christa P and Agiro Seth O
Home Financials for this Owner
Home Financials are based on the most recent Mortgage that was taken out on this home.
Original Mortgage
$54,667
Outstanding Balance
$36,448
Interest Rate
6.57%
Mortgage Type
FHA
Estimated Equity
$130,702
Purchase Details
Closed on
Jun 21, 2007
Sold by
Holcomb James M and Holcomb Lori A
Bought by
Hud
Purchase Details
Closed on
Sep 17, 2001
Sold by
Schum John and Schum Sandra
Bought by
Holcomb James M and Holcomb Lori A
Home Financials for this Owner
Home Financials are based on the most recent Mortgage that was taken out on this home.
Original Mortgage
$109,214
Interest Rate
6.72%
Mortgage Type
FHA
Create a Home Valuation Report for This Property
The Home Valuation Report is an in-depth analysis detailing your home's value as well as a comparison with similar homes in the area
Home Values in the Area
Average Home Value in this Area
Purchase History
| Date | Buyer | Sale Price | Title Company |
|---|---|---|---|
| Cultice Wendell W | $78,000 | None Available | |
| Agiro Christa P | $50,000 | Lakeside Title & Escrow Agen | |
| Hud | $124,519 | None Available | |
| Holcomb James M | $27,750 | -- |
Source: Public Records
Mortgage History
| Date | Status | Borrower | Loan Amount |
|---|---|---|---|
| Open | Agiro Christa P | $54,667 | |
| Previous Owner | Holcomb James M | $109,214 |
Source: Public Records
Tax History Compared to Growth
Tax History
| Year | Tax Paid | Tax Assessment Tax Assessment Total Assessment is a certain percentage of the fair market value that is determined by local assessors to be the total taxable value of land and additions on the property. | Land | Improvement |
|---|---|---|---|---|
| 2024 | $1,439 | $33,030 | $4,580 | $28,450 |
| 2023 | $1,439 | $33,030 | $4,580 | $28,450 |
| 2022 | $1,276 | $25,430 | $3,660 | $21,770 |
| 2021 | $1,293 | $25,430 | $3,660 | $21,770 |
| 2020 | $1,239 | $25,430 | $3,660 | $21,770 |
| 2019 | $1,159 | $22,400 | $3,380 | $19,020 |
| 2018 | $1,164 | $22,400 | $3,380 | $19,020 |
| 2017 | $1,130 | $22,400 | $3,380 | $19,020 |
| 2016 | $1,106 | $20,890 | $3,380 | $17,510 |
| 2015 | $1,053 | $19,840 | $3,380 | $16,460 |
| 2014 | $1,008 | $19,840 | $3,380 | $16,460 |
Source: Public Records
Map
Nearby Homes
- 847 S Detroit St
- 46 Lake St
- 55 Lake St
- 633 Xenia Ave
- 260 Pocahontas St
- 979 Mcdowell St
- 148 Home Ave
- 293 S Miami Ave
- 104 Ledbetter Rd
- 400 S Detroit St
- 222 Washington St
- 453 Walnut St
- 523 Newport Rd
- 36 Leaman St
- 98 W 3rd St
- 733 State Route 380
- 305-325 Bellbrook Ave
- 75 W 2nd St
- 654 E 3rd St
- 541 E Main St
- 901 S Detroit St
- 885 S Detroit St
- 909 S Detroit St
- 39 Thornhill Ave
- 869 S Detroit St
- 51 Thornhill Ave
- 863 S Detroit St
- 919 S Detroit St
- 930 Nicholas St
- 859 S Detroit St
- 63 Thornhill Ave
- 944 Nicholas St
- 935 S Detroit St
- 44 Thornhill Ave
- 888 S Detroit St
- 896 S Detroit St
- 878 S Detroit St
- 908 S Detroit St
- 954 Nicholas St
- 54 Thornhill Ave