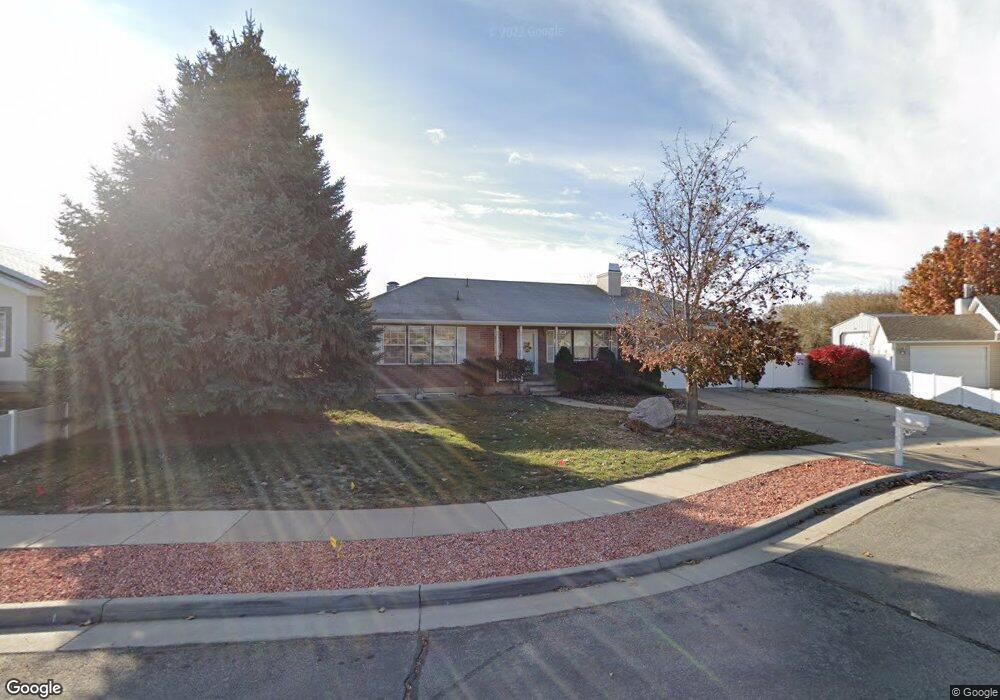
893 W 910 N Clearfield, UT 84015
Estimated Value: $435,000 - $487,274
3
Beds
2
Baths
1,176
Sq Ft
$395/Sq Ft
Est. Value
About This Home
This home is located at 893 W 910 N, Clearfield, UT 84015 and is currently estimated at $464,319, approximately $394 per square foot. 893 W 910 N is a home located in Davis County with nearby schools including Clinton Elementary School, Sunset Junior High School, and Clearfield High School.
Ownership History
Date
Name
Owned For
Owner Type
Purchase Details
Closed on
May 18, 1998
Sold by
Tcci Inc
Bought by
Read Larry W and Read Cindy K
Current Estimated Value
Home Financials for this Owner
Home Financials are based on the most recent Mortgage that was taken out on this home.
Original Mortgage
$70,000
Interest Rate
6.77%
Purchase Details
Closed on
Jun 30, 1997
Sold by
Terra Firma Inc
Bought by
Tcci Inc
Create a Home Valuation Report for This Property
The Home Valuation Report is an in-depth analysis detailing your home's value as well as a comparison with similar homes in the area
Home Values in the Area
Average Home Value in this Area
Purchase History
| Date | Buyer | Sale Price | Title Company |
|---|---|---|---|
| Read Larry W | -- | Bonneville Title Company | |
| Tcci Inc | -- | Bonneville Title Company Inc |
Source: Public Records
Mortgage History
| Date | Status | Borrower | Loan Amount |
|---|---|---|---|
| Closed | Read Larry W | $70,000 |
Source: Public Records
Tax History
| Year | Tax Paid | Tax Assessment Tax Assessment Total Assessment is a certain percentage of the fair market value that is determined by local assessors to be the total taxable value of land and additions on the property. | Land | Improvement |
|---|---|---|---|---|
| 2025 | $353 | $250,250 | $92,509 | $157,741 |
| 2024 | $374 | $242,000 | $101,463 | $140,537 |
| 2023 | $2,354 | $421,000 | $115,832 | $305,168 |
| 2022 | $2,496 | $246,950 | $70,377 | $176,573 |
| 2021 | $2,235 | $328,000 | $88,912 | $239,088 |
| 2020 | $1,948 | $283,000 | $75,981 | $207,019 |
| 2019 | $1,860 | $264,000 | $87,992 | $176,008 |
| 2018 | $1,750 | $244,000 | $74,218 | $169,782 |
| 2016 | $1,672 | $120,396 | $28,991 | $91,405 |
| 2015 | $1,577 | $107,966 | $28,991 | $78,975 |
| 2014 | $1,525 | $106,064 | $28,991 | $77,073 |
| 2013 | -- | $96,264 | $27,143 | $69,121 |
Source: Public Records
Map
Nearby Homes
- 844 N 1000 W
- 1038 W 800 N
- 1132 N 780 W
- 690 Barlow St
- 721 N 800 W
- 626 W 800 N
- 593 W 950 N
- 652 W 800 N Unit 62
- 1214 N 700 W
- 1125 W 700 N
- 584 W 1350 N
- 1226 N 450 W
- 417 N 1200 W Unit 84
- 563 N 1350 W Unit 139
- 1350 W 300 N Unit 29
- 1411 W 570 N
- 1239 W 400 N Unit 63
- 1251 W 400 N Unit 67
- 4356 W 475 S
- 777 W 300 N
Your Personal Tour Guide
Ask me questions while you tour the home.