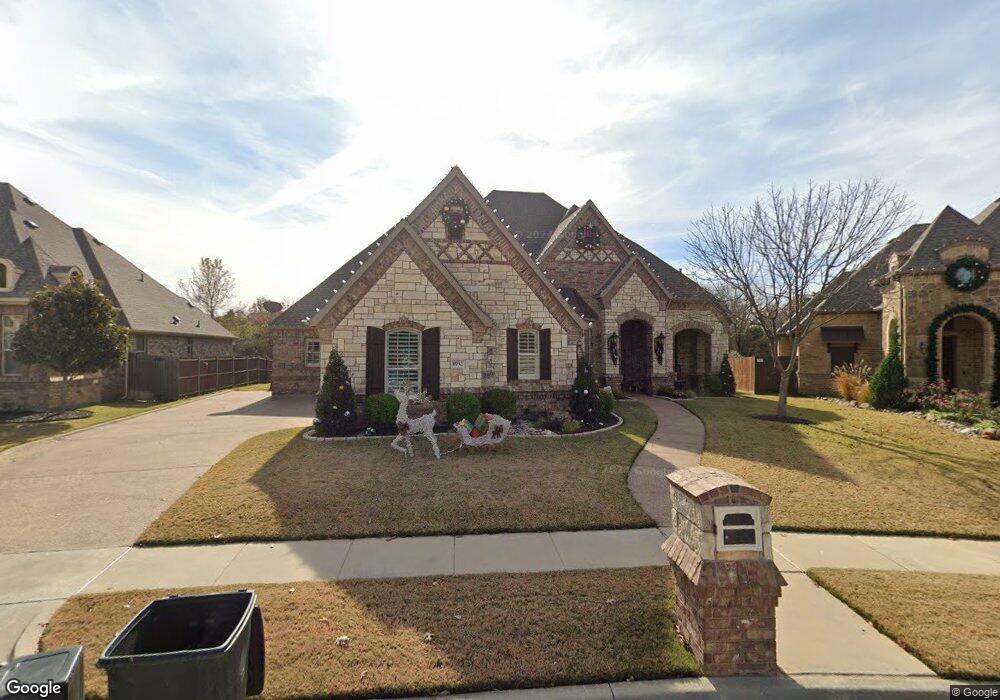
8932 Souththorn Dr North Richland Hills, TX 76182
Estimated Value: $679,000 - $813,000
3
Beds
3
Baths
3,155
Sq Ft
$232/Sq Ft
Est. Value
About This Home
This home is located at 8932 Souththorn Dr, North Richland Hills, TX 76182 and is currently estimated at $733,265, approximately $232 per square foot. 8932 Souththorn Dr is a home located in Tarrant County with nearby schools including W.A. Porter Elementary School, Smithfield Middle School, and Birdville High School.
Ownership History
Date
Name
Owned For
Owner Type
Purchase Details
Closed on
Aug 23, 2017
Sold by
Friedman Barry and Friedman Shirli R
Bought by
Arwine Jeff K and Arwine Heidi A
Current Estimated Value
Home Financials for this Owner
Home Financials are based on the most recent Mortgage that was taken out on this home.
Original Mortgage
$335,825
Outstanding Balance
$280,748
Interest Rate
4.03%
Mortgage Type
New Conventional
Estimated Equity
$452,517
Purchase Details
Closed on
Feb 27, 2013
Sold by
J & J Nrh 100 Flp
Bought by
Friedman Barry and Friedman Shirli R
Home Financials for this Owner
Home Financials are based on the most recent Mortgage that was taken out on this home.
Original Mortgage
$407,095
Interest Rate
3.43%
Mortgage Type
Purchase Money Mortgage
Create a Home Valuation Report for This Property
The Home Valuation Report is an in-depth analysis detailing your home's value as well as a comparison with similar homes in the area
Home Values in the Area
Average Home Value in this Area
Purchase History
| Date | Buyer | Sale Price | Title Company |
|---|---|---|---|
| Arwine Jeff K | -- | Alamo Title Co | |
| Friedman Barry | -- | First Western Title Co |
Source: Public Records
Mortgage History
| Date | Status | Borrower | Loan Amount |
|---|---|---|---|
| Open | Arwine Jeff K | $335,825 | |
| Previous Owner | Friedman Barry | $407,095 |
Source: Public Records
Tax History Compared to Growth
Tax History
| Year | Tax Paid | Tax Assessment Tax Assessment Total Assessment is a certain percentage of the fair market value that is determined by local assessors to be the total taxable value of land and additions on the property. | Land | Improvement |
|---|---|---|---|---|
| 2025 | $11,676 | $633,000 | $104,678 | $528,322 |
| 2024 | $11,676 | $666,353 | $104,678 | $561,675 |
| 2023 | $12,856 | $678,767 | $104,678 | $574,089 |
| 2022 | $12,821 | $584,480 | $104,678 | $479,802 |
| 2021 | $12,325 | $484,350 | $100,000 | $384,350 |
| 2020 | $12,477 | $490,364 | $100,000 | $390,364 |
| 2019 | $13,299 | $505,000 | $100,000 | $405,000 |
| 2018 | $12,773 | $516,036 | $100,000 | $416,036 |
| 2017 | $11,561 | $477,157 | $100,000 | $377,157 |
| 2016 | $10,510 | $390,628 | $100,000 | $290,628 |
| 2015 | $8,345 | $470,256 | $60,000 | $410,256 |
| 2014 | $8,345 | $421,600 | $60,000 | $361,600 |
Source: Public Records
Map
Nearby Homes
- 7905 Hallmark Dr
- 7908 Hallmark Dr
- 8200 Thornhill Dr
- 8932 Thornberry Dr
- 9216 Cachelle Ct
- 9216 Hailey Ct
- TBD Kirk Ln
- 8113 Biscayne Ct
- 8205 Edgemont Ct
- 616A Plan at Adkins Park - 70'
- 655A Plan at Adkins Park - 70'
- 634A Plan at Adkins Park - 70'
- 585A Plan at Adkins Park - 70'
- 620A Plan at Adkins Park - 70'
- 625A Plan at Adkins Park - 70'
- 650A Plan at Adkins Park - 70'
- 586A Plan at Adkins Park - 70'
- 617A Plan at Adkins Park - 70'
- 651A Plan at Adkins Park - 70'
- 566A Plan at Adkins Park - 70'
- 8928 Souththorn Dr
- 8936 Souththorn Dr
- 8940 Souththorn Dr
- 8924 Souththorn Dr
- 8937 Souththorn Dr
- 8944 Souththorn Dr
- 8941 Souththorn Dr
- 8945 Souththorn Dr
- 8948 Souththorn Dr
- 8940 Glendara Dr
- 8944 Glendara Dr
- 8949 Souththorn Dr
- 8952 Souththorn Dr
- 8948 Glendara Dr
- 8953 Souththorn Dr
- 8956 Souththorn Dr
- 8952 Glendara Dr
- 8945 Glendara Dr
- 8957 Souththorn Dr
- 8956 Glendara Dr