
Seller's Agent in 2022
Chris Cooley
Windermere Corporate
(206) 595-8861
2 in this area
121 Total Sales
Estimated Value: $1,559,000 - $1,793,000
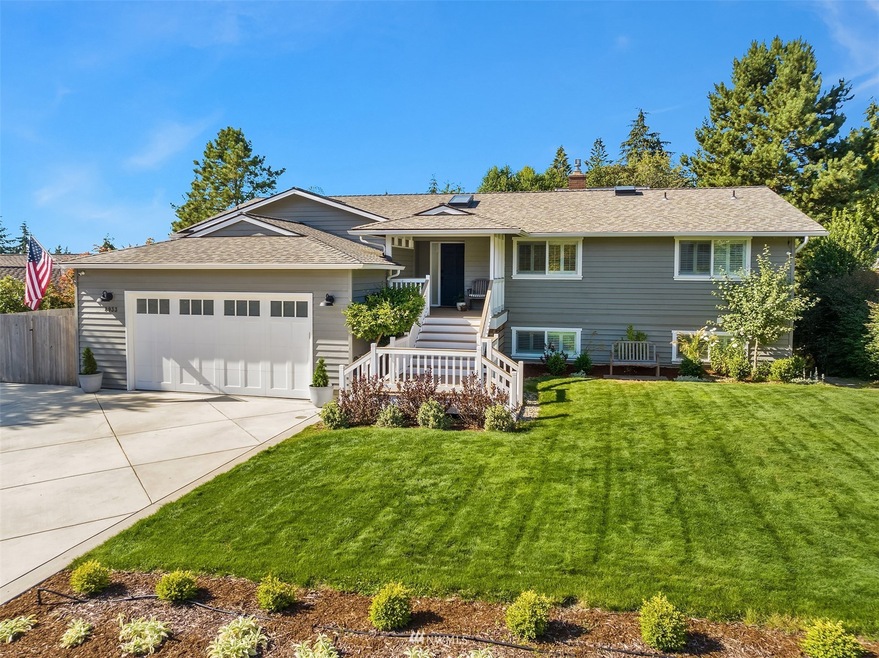
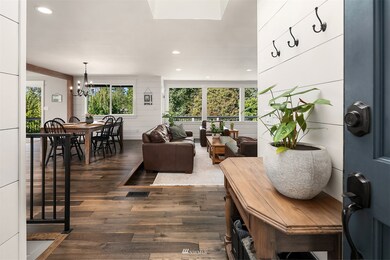
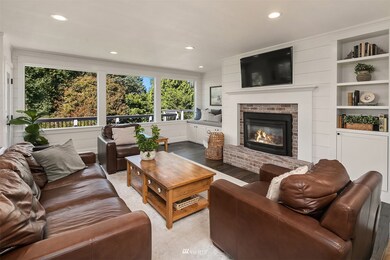
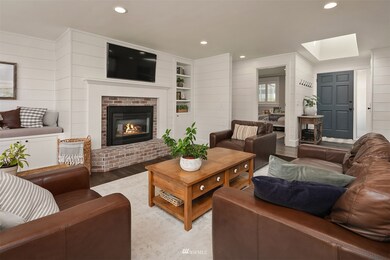
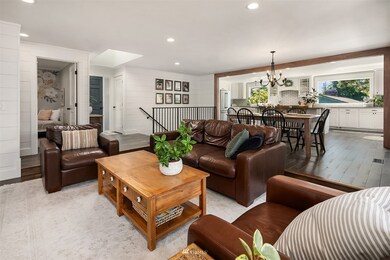
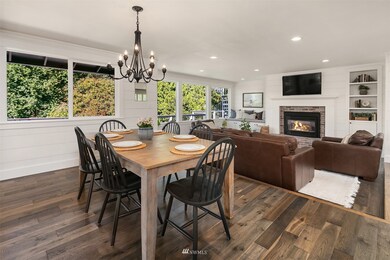
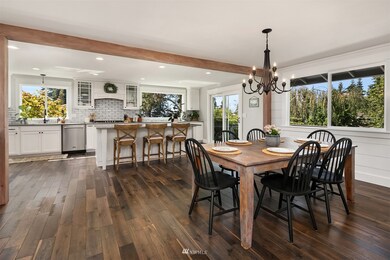
Located in Talbot Park just a short walk to beautiful SW County Park and all of its trails and abundance of nature. This 5 bedroom home has been totally updated and will leave you speechless. Only the finest of remodels has transformed this home into a work of art. The open concept main floor has huge windows, tons of light and Puget Sound views. The well-designed kitchen is the perfect place to gather with friends and loved ones. The private backyard has tons of room to play, a fire pit, garden beds, a chicken coop, new top-of-the-line deck with spiral staircase leading you to a rooftop deck sure to impress. This home even has a separate 1 bedroom/1 bathroom MIL unit with submeter and profitable Airbnb history.
Last Agent to Sell the Property
Windermere Real Estate GH LLC License #85900 Listed on: 07/28/2022
Last Buyer's Agent
Nancie Wood
Windermere Real Estate GH LLC License #12883
Source: Northwest Multiple Listing Service (NWMLS)
MLS#: 1973509
| Date | Buyer | Sale Price | Title Company |
|---|---|---|---|
| Gudaitis Mark William | -- | -- | |
| Gage Adam | $600,000 | Chicago Title | |
| Chang Yun Fong | $639,000 | Fidelity National Title | |
| Funk Roy I | $375,000 | -- | |
| Langsam Peter David | $270,000 | Fidelity National Title |
| Date | Status | Borrower | Loan Amount |
|---|---|---|---|
| Open | Gudaitis Mark William | $891,250 | |
| Previous Owner | Gage Adam | $400,000 | |
| Previous Owner | Funk Roy I | $275,000 | |
| Previous Owner | Langsam Peter David | $175,000 |
| Date | Event | Price | List to Sale | Price per Sq Ft | Prior Sale |
|---|---|---|---|---|---|
| 09/08/2022 09/08/22 | Sold | $1,650,000 | -2.1% | $480 / Sq Ft | |
| 08/03/2022 08/03/22 | Pending | -- | -- | -- | |
| 07/28/2022 07/28/22 | For Sale | $1,685,000 | +180.8% | $491 / Sq Ft | |
| 03/10/2016 03/10/16 | Sold | $600,000 | -4.0% | $175 / Sq Ft | View Prior Sale |
| 01/15/2016 01/15/16 | Pending | -- | -- | -- | |
| 10/22/2015 10/22/15 | For Sale | $625,000 | -- | $182 / Sq Ft |
| Year | Tax Paid | Tax Assessment Tax Assessment Total Assessment is a certain percentage of the fair market value that is determined by local assessors to be the total taxable value of land and additions on the property. | Land | Improvement |
|---|---|---|---|---|
| 2025 | $8,204 | $1,263,000 | $686,000 | $577,000 |
| 2024 | $8,204 | $1,162,800 | $586,000 | $576,800 |
| 2023 | $7,197 | $1,057,000 | $621,000 | $436,000 |
| 2022 | $6,693 | $808,300 | $436,000 | $372,300 |
| 2020 | $5,282 | $568,500 | $408,000 | $160,500 |
| 2019 | $4,849 | $526,000 | $365,000 | $161,000 |
| 2018 | $5,143 | $482,100 | $338,000 | $144,100 |
| 2017 | $4,598 | $451,500 | $309,000 | $142,500 |
| 2016 | $4,341 | $422,600 | $282,000 | $140,600 |
| 2015 | $4,572 | $419,200 | $269,000 | $150,200 |
| 2013 | $5,620 | $486,700 | $272,000 | $214,700 |
Seller's Agent in 2022
Chris Cooley
Windermere Corporate
(206) 595-8861
2 in this area
121 Total Sales
N
Buyer's Agent in 2022
Nancie Wood
Windermere Corporate
Seller's Agent in 2016
Mark Hewitt
Keller Williams Realty Bothell
(425) 481-8889
1 in this area
75 Total Sales
K
Buyer's Agent in 2016
Katie Dayley
Pacific Properties
(425) 673-5229
1 Total Sale
Source: Northwest Multiple Listing Service (NWMLS)
MLS Number: 1973509
APN: 004590-000-002-00
Disclaimer: Certain information contained herein is derived from information provided by parties other than Homes.com. All information provided is deemed reliable, but is not guaranteed to be accurate and should be independently verified.
![]() All data is obtained from various sources and may not have been verified by broker or MLS GRID. Supplied Open House Information is subject to change without notice. All information should be independently reviewed and verified for accuracy. Properties may or may not be listed by the office/agent presenting the information. Listing information is provided by the Northwest Multiple Listing Service (NWMLS). Property information is based on available data that may include MLS information, county records, and other sources. Listings marked with the 3 tree icon and provided by NWMLS. All properties are subject to prior sale or withdrawal. IDX information is provided exclusively for consumers’ personal noncommercial use, that it may not be used for any purpose other than to identify prospective properties consumers may be interested in purchasing, that the data is deemed reliable but is not guaranteed by MLS GRID. ©2025 NWMLS.
All data is obtained from various sources and may not have been verified by broker or MLS GRID. Supplied Open House Information is subject to change without notice. All information should be independently reviewed and verified for accuracy. Properties may or may not be listed by the office/agent presenting the information. Listing information is provided by the Northwest Multiple Listing Service (NWMLS). Property information is based on available data that may include MLS information, county records, and other sources. Listings marked with the 3 tree icon and provided by NWMLS. All properties are subject to prior sale or withdrawal. IDX information is provided exclusively for consumers’ personal noncommercial use, that it may not be used for any purpose other than to identify prospective properties consumers may be interested in purchasing, that the data is deemed reliable but is not guaranteed by MLS GRID. ©2025 NWMLS.
Based on information submitted to the MLS GRID