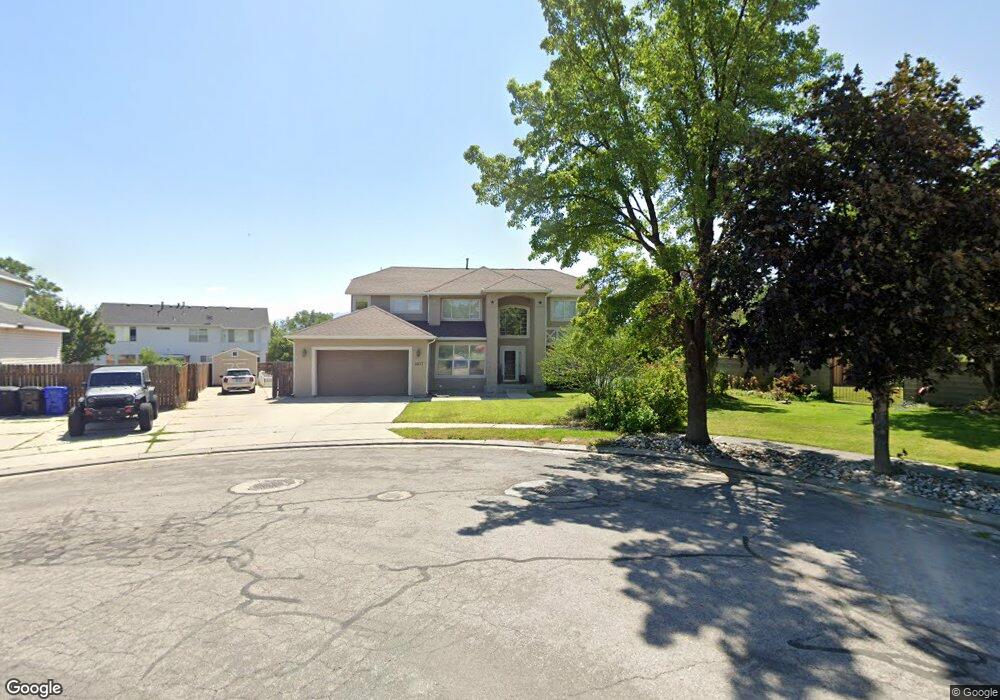
8937 Deep Creek Dr West Jordan, UT 84081
Copper Hills NeighborhoodEstimated Value: $672,000 - $713,496
6
Beds
3
Baths
3,960
Sq Ft
$175/Sq Ft
Est. Value
About This Home
This home is located at 8937 Deep Creek Dr, West Jordan, UT 84081 and is currently estimated at $691,624, approximately $174 per square foot. 8937 Deep Creek Dr is a home located in Salt Lake County with nearby schools including Copper Canyon School, West Hills Middle School, and Copper Hills High School.
Ownership History
Date
Name
Owned For
Owner Type
Purchase Details
Closed on
Oct 16, 2015
Sold by
Monell Scott J and Monell Petra E
Bought by
Rollins Aaron and Rollins Laura
Current Estimated Value
Home Financials for this Owner
Home Financials are based on the most recent Mortgage that was taken out on this home.
Original Mortgage
$288,397
Outstanding Balance
$226,754
Interest Rate
3.86%
Mortgage Type
New Conventional
Estimated Equity
$464,870
Purchase Details
Closed on
Oct 24, 2008
Sold by
Butters Robert K and Butters Holly J
Bought by
Monell Scott J and Monell Petra E
Home Financials for this Owner
Home Financials are based on the most recent Mortgage that was taken out on this home.
Original Mortgage
$270,751
Interest Rate
5.9%
Mortgage Type
FHA
Purchase Details
Closed on
Mar 28, 1996
Sold by
Ryland Homes
Bought by
Butters Robert K and Butters Holly J
Home Financials for this Owner
Home Financials are based on the most recent Mortgage that was taken out on this home.
Original Mortgage
$173,200
Interest Rate
6.98%
Create a Home Valuation Report for This Property
The Home Valuation Report is an in-depth analysis detailing your home's value as well as a comparison with similar homes in the area
Home Values in the Area
Average Home Value in this Area
Purchase History
| Date | Buyer | Sale Price | Title Company |
|---|---|---|---|
| Rollins Aaron | -- | Old Republic Title So Jordan | |
| Monell Scott J | -- | Sutherland Title | |
| Butters Robert K | -- | -- |
Source: Public Records
Mortgage History
| Date | Status | Borrower | Loan Amount |
|---|---|---|---|
| Open | Rollins Aaron | $288,397 | |
| Previous Owner | Monell Scott J | $270,751 | |
| Previous Owner | Butters Robert K | $173,200 |
Source: Public Records
Tax History Compared to Growth
Tax History
| Year | Tax Paid | Tax Assessment Tax Assessment Total Assessment is a certain percentage of the fair market value that is determined by local assessors to be the total taxable value of land and additions on the property. | Land | Improvement |
|---|---|---|---|---|
| 2025 | $3,387 | $656,800 | $184,500 | $472,300 |
| 2024 | $3,387 | $651,700 | $182,700 | $469,000 |
| 2023 | $3,423 | $620,700 | $172,300 | $448,400 |
| 2022 | $3,338 | $595,400 | $169,000 | $426,400 |
| 2021 | $2,822 | $458,200 | $131,300 | $326,900 |
| 2020 | $2,657 | $404,900 | $131,300 | $273,600 |
| 2019 | $2,624 | $392,200 | $123,900 | $268,300 |
| 2018 | $2,392 | $354,600 | $123,900 | $230,700 |
| 2017 | $2,273 | $335,500 | $123,900 | $211,600 |
| 2016 | $2,198 | $304,700 | $123,900 | $180,800 |
| 2015 | $1,954 | $264,200 | $131,000 | $133,200 |
| 2014 | $1,787 | $237,900 | $120,400 | $117,500 |
Source: Public Records
Map
Nearby Homes
- 8854 Rocky Creek Dr
- 5098 Cherry Laurel Ln
- 9118 S Wisteria Way
- 8793 S Big Bar Ct
- 5582 Washoe Cove
- 8577 Autumn Gold Cir
- 4904 Wild Acres Dr
- 4887 W 8620 S
- 9332 S Wild Clover Ln
- 8453 S Windmill Dr
- 8441 S Spratling Dr
- 4624 Pine Crossing Dr
- 8322 Copper Vista Cir
- 4707 W Granada Hills Ct
- 7903 Mckenzie Ln
- 7886 Mckenzie Ln
- 5746 W Swift Creek Rd
- 8501 S Michele River Ave
- 8501 S Michele River Ave Unit 116
- 5946 W Eric Mountain Ln Unit 103
- 8937 S Deep Creek Dr
- 5275 Deep Creek Dr
- 8938 Mountain Vista Dr
- 8925 S Deep Creek Dr
- 8925 Deep Creek Dr
- 5252 Mountain Vista Dr
- 5252 W Mountain Vista Dr
- 5266 Mountain Vista Dr
- 8926 S Mountain Vista Dr
- 8926 Mountain Vista Dr
- 5236 Mountain Vista Dr
- 5287 Deep Creek Dr
- 5287 W Deep Creek Dr
- 5282 Mountain Vista Dr
- 5282 W Mountain Vista Dr
- 8914 S Mountain Vista Dr
- 8914 Mountain Vista Dr
- 8909 Deep Creek Dr
- 8918 Deep Creek Dr
- 5296 Mountain Vista Dr