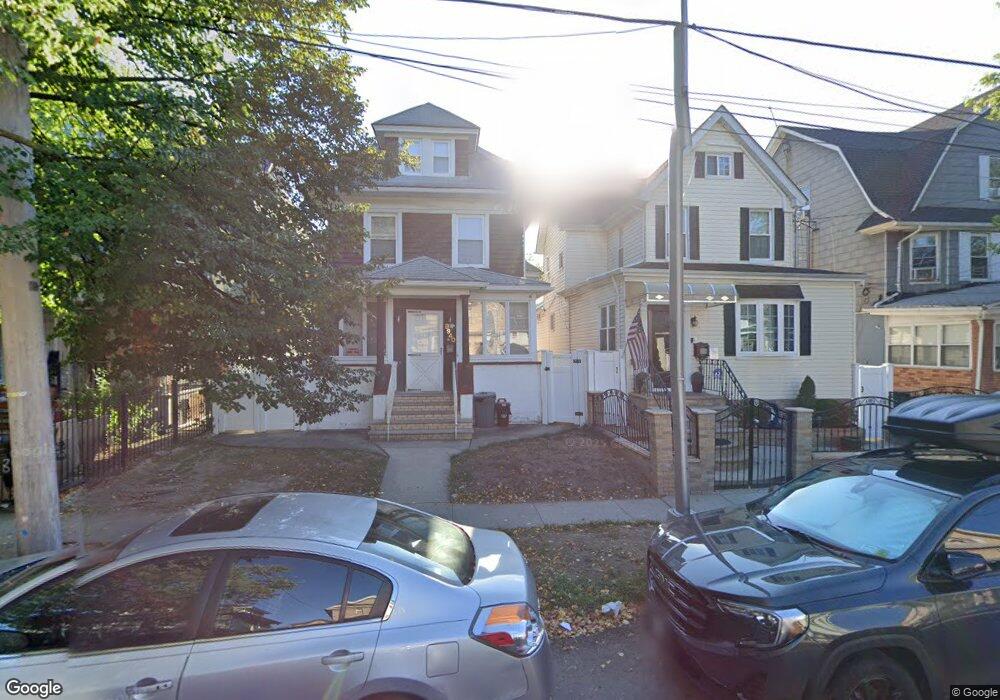
8938 97th St Woodhaven, NY 11421
Woodhaven NeighborhoodEstimated Value: $754,000 - $803,000
--
Bed
--
Bath
1,709
Sq Ft
$457/Sq Ft
Est. Value
About This Home
This home is located at 8938 97th St, Woodhaven, NY 11421 and is currently estimated at $781,000, approximately $456 per square foot. 8938 97th St is a home located in Queens County with nearby schools including P.S. 254 - The Rosa Parks School, Jhs 210 Elizabeth Blackwell, and Richmond Hill High School.
Ownership History
Date
Name
Owned For
Owner Type
Purchase Details
Closed on
May 20, 2008
Sold by
Deleon Germania
Bought by
Rodriguez Carmen and Toro Luis
Current Estimated Value
Home Financials for this Owner
Home Financials are based on the most recent Mortgage that was taken out on this home.
Original Mortgage
$427,885
Outstanding Balance
$274,220
Interest Rate
6.11%
Mortgage Type
Purchase Money Mortgage
Estimated Equity
$506,780
Purchase Details
Closed on
Sep 29, 2006
Sold by
Niyazov Zhanna
Bought by
Deleon Germania
Home Financials for this Owner
Home Financials are based on the most recent Mortgage that was taken out on this home.
Original Mortgage
$480,000
Interest Rate
6.49%
Mortgage Type
Purchase Money Mortgage
Purchase Details
Closed on
May 15, 2006
Sold by
Rosa Gilberto
Bought by
Niyazov Zhanna
Home Financials for this Owner
Home Financials are based on the most recent Mortgage that was taken out on this home.
Original Mortgage
$440,000
Interest Rate
6.62%
Mortgage Type
Purchase Money Mortgage
Purchase Details
Closed on
Sep 16, 2005
Sold by
Cendant Mobility Financial Corporation
Bought by
Rosa Gilberto
Home Financials for this Owner
Home Financials are based on the most recent Mortgage that was taken out on this home.
Original Mortgage
$86,000
Interest Rate
5.84%
Purchase Details
Closed on
May 29, 2005
Sold by
Hambrick Casanova and Hambrick Susan
Bought by
Cendant Mobility Financial Corporation
Home Financials for this Owner
Home Financials are based on the most recent Mortgage that was taken out on this home.
Original Mortgage
$344,000
Interest Rate
5.84%
Mortgage Type
Purchase Money Mortgage
Purchase Details
Closed on
May 3, 1996
Sold by
Lopez Javier and Lopez Debra A
Bought by
Hambrick Casanova and Hambrick Susan
Create a Home Valuation Report for This Property
The Home Valuation Report is an in-depth analysis detailing your home's value as well as a comparison with similar homes in the area
Home Values in the Area
Average Home Value in this Area
Purchase History
| Date | Buyer | Sale Price | Title Company |
|---|---|---|---|
| Rodriguez Carmen | $434,600 | -- | |
| Rodriguez Carmen | $434,600 | -- | |
| Deleon Germania | $600,000 | -- | |
| Deleon Germania | $600,000 | -- | |
| Niyazov Zhanna | $550,000 | -- | |
| Niyazov Zhanna | $550,000 | -- | |
| Rosa Gilberto | $430,000 | -- | |
| Rosa Gilberto | $430,000 | -- | |
| Cendant Mobility Financial Corporation | $430,000 | -- | |
| Cendant Mobility Financial Corporation | $430,000 | -- | |
| Hambrick Casanova | $165,000 | Commonwealth Land Title Ins | |
| Hambrick Casanova | $165,000 | Commonwealth Land Title Ins |
Source: Public Records
Mortgage History
| Date | Status | Borrower | Loan Amount |
|---|---|---|---|
| Open | Rodriguez Carmen | $427,885 | |
| Closed | Rodriguez Carmen | $427,885 | |
| Previous Owner | Deleon Germania | $480,000 | |
| Previous Owner | Niyazov Zhanna | $440,000 | |
| Previous Owner | Rosa Gilberto | $86,000 | |
| Previous Owner | Rosa Gilberto | $344,000 | |
| Previous Owner | Cendant Mobility Financial Corporation | $344,000 |
Source: Public Records
Tax History Compared to Growth
Tax History
| Year | Tax Paid | Tax Assessment Tax Assessment Total Assessment is a certain percentage of the fair market value that is determined by local assessors to be the total taxable value of land and additions on the property. | Land | Improvement |
|---|---|---|---|---|
| 2025 | $6,541 | $35,832 | $9,538 | $26,294 |
| 2024 | $6,553 | $33,966 | $10,544 | $23,422 |
| 2023 | $6,195 | $32,246 | $8,749 | $23,497 |
| 2022 | $5,903 | $41,640 | $13,560 | $28,080 |
| 2021 | $4,355 | $44,520 | $13,560 | $30,960 |
| 2020 | $6,024 | $40,620 | $13,560 | $27,060 |
| 2019 | $5,628 | $38,520 | $13,560 | $24,960 |
| 2018 | $5,180 | $26,872 | $9,779 | $17,093 |
| 2017 | $4,886 | $25,437 | $10,193 | $15,244 |
| 2016 | $4,664 | $25,437 | $10,193 | $15,244 |
| 2015 | $2,675 | $24,883 | $14,730 | $10,153 |
| 2014 | $2,675 | $23,588 | $13,964 | $9,624 |
Source: Public Records
Map
Nearby Homes