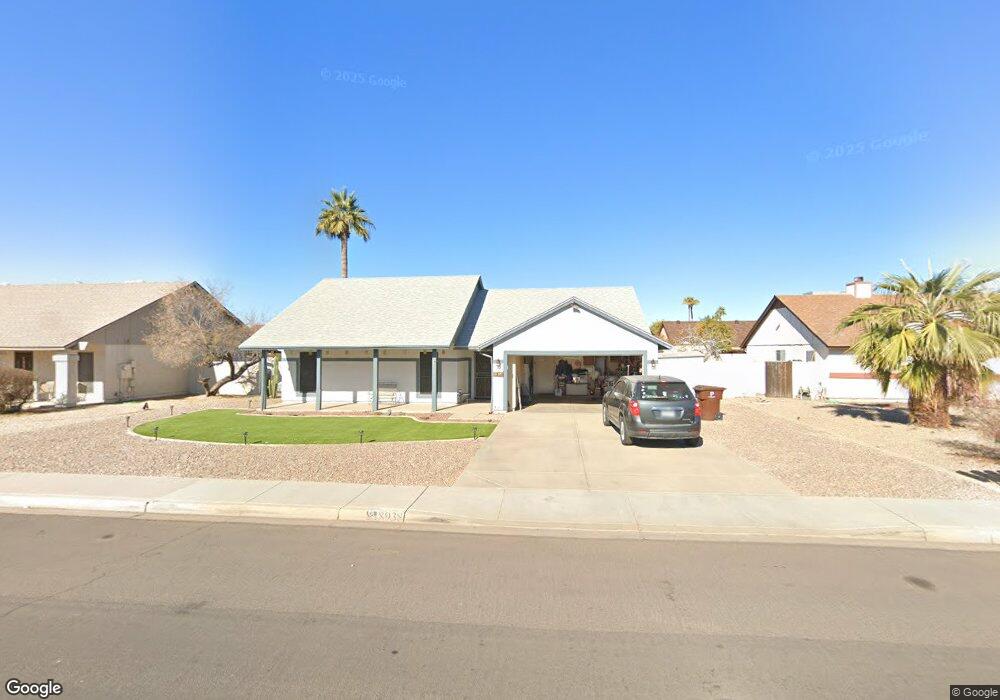
8938 W Hatcher Rd Peoria, AZ 85345
Estimated Value: $325,099 - $430,000
--
Bed
2
Baths
1,876
Sq Ft
$208/Sq Ft
Est. Value
About This Home
This home is located at 8938 W Hatcher Rd, Peoria, AZ 85345 and is currently estimated at $389,275, approximately $207 per square foot. 8938 W Hatcher Rd is a home located in Maricopa County with nearby schools including Alta Loma School, Raymond S. Kellis, and Peoria Accelerated High School.
Ownership History
Date
Name
Owned For
Owner Type
Purchase Details
Closed on
May 9, 2024
Sold by
Ellis Amy L and Devilbiss Debora K
Bought by
Ellis Devilbiss Living Trust and Ellis
Current Estimated Value
Purchase Details
Closed on
May 17, 2002
Sold by
Crockett Todd C
Bought by
Devilbiss Debora and Ellis Amy L
Home Financials for this Owner
Home Financials are based on the most recent Mortgage that was taken out on this home.
Original Mortgage
$88,500
Interest Rate
7.25%
Mortgage Type
New Conventional
Purchase Details
Closed on
Sep 8, 1995
Sold by
Hegedus Kent R
Bought by
Crockett Todd C and Crockett Elaine C
Home Financials for this Owner
Home Financials are based on the most recent Mortgage that was taken out on this home.
Original Mortgage
$77,962
Interest Rate
7.97%
Mortgage Type
VA
Create a Home Valuation Report for This Property
The Home Valuation Report is an in-depth analysis detailing your home's value as well as a comparison with similar homes in the area
Home Values in the Area
Average Home Value in this Area
Purchase History
| Date | Buyer | Sale Price | Title Company |
|---|---|---|---|
| Ellis Devilbiss Living Trust | -- | Final Title Support | |
| Devilbiss Debora | $118,000 | Capital Title Agency Inc | |
| Crockett Todd C | $88,500 | Security Title Agency |
Source: Public Records
Mortgage History
| Date | Status | Borrower | Loan Amount |
|---|---|---|---|
| Previous Owner | Devilbiss Debora | $88,500 | |
| Previous Owner | Crockett Todd C | $77,962 | |
| Closed | Devilbiss Debora | $29,500 |
Source: Public Records
Tax History Compared to Growth
Tax History
| Year | Tax Paid | Tax Assessment Tax Assessment Total Assessment is a certain percentage of the fair market value that is determined by local assessors to be the total taxable value of land and additions on the property. | Land | Improvement |
|---|---|---|---|---|
| 2025 | $1,103 | $14,167 | -- | -- |
| 2024 | $1,086 | $13,492 | -- | -- |
| 2023 | $1,086 | $29,220 | $5,840 | $23,380 |
| 2022 | $1,064 | $22,570 | $4,510 | $18,060 |
| 2021 | $1,139 | $20,600 | $4,120 | $16,480 |
| 2020 | $1,149 | $19,570 | $3,910 | $15,660 |
| 2019 | $1,112 | $17,720 | $3,540 | $14,180 |
| 2018 | $1,075 | $16,550 | $3,310 | $13,240 |
| 2017 | $1,076 | $14,320 | $2,860 | $11,460 |
| 2016 | $1,065 | $14,130 | $2,820 | $11,310 |
| 2015 | $994 | $12,850 | $2,570 | $10,280 |
Source: Public Records
Map
Nearby Homes
- 8933 W Mountain View Rd
- 0 W Olive Ave Unit N
- 10899 W Olive Ave Unit G
- 8953 W Townley Ave
- 8727 W Townley Ave
- 9903 N 87th Dr
- 8559 W Sunnyslope Ln
- 8609 W Eva St
- 8676 W Mountain View Rd
- 8708 W Golden Ln
- 8644 W Mountain View Rd
- 8992 W Ruth Ave
- 10101 N 91st Ave Unit 124
- 8556 W Caron Dr Unit 1
- 8645 W Olive Ave Unit K
- 8625 W Olive Ave
- 8557 W Malapai Dr
- 9243 W Brown St
- 8632 W Ruth Ave
- 8978 W Orchid Ln
- 8932 W Hatcher Rd
- 8944 W Hatcher Rd
- 8939 W Carol Ave Unit 1
- 8945 W Carol Ave
- 8933 W Carol Ave
- 8926 W Hatcher Rd
- 9002 W Hatcher Rd
- 8939 W Hatcher Rd
- 9003 W Carol Ave
- 8945 W Hatcher Rd
- 8927 W Hatcher Rd
- 9003 W Hatcher Rd
- 8920 W Hatcher Rd
- 9008 W Hatcher Rd Unit 1
- 9009 W Carol Ave
- 8921 W Carol Ave
- 8938 W Carol Ave
- 8944 W Carol Ave
- 8932 W Carol Ave
- 8921 W Hatcher Rd Unit I