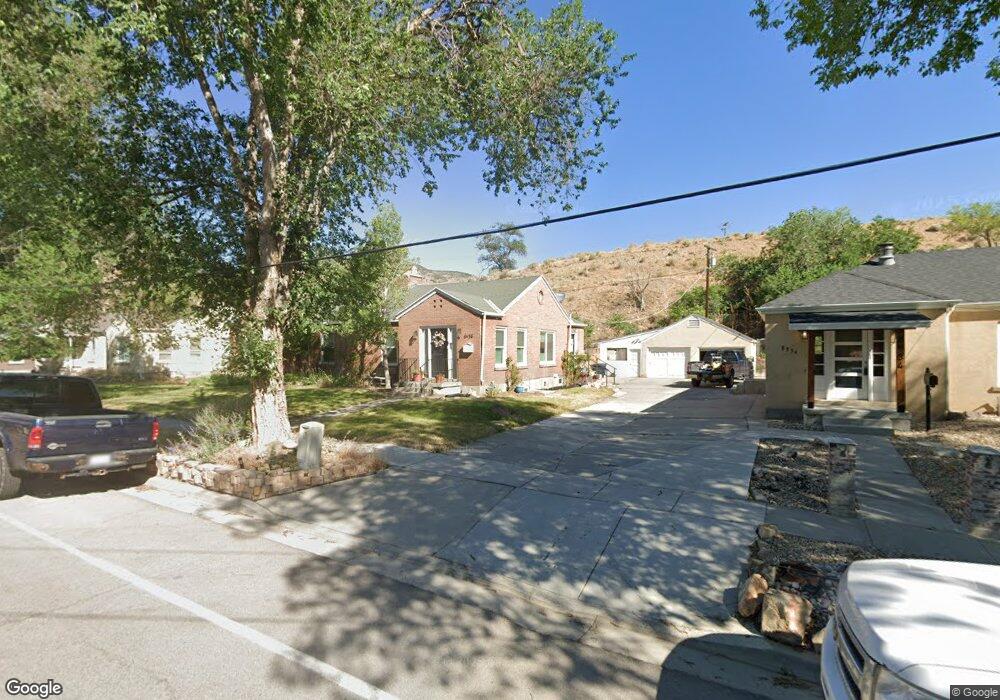
8938 W State Hwy Bingham Canyon, UT 84006
Estimated Value: $340,000 - $388,531
3
Beds
2
Baths
1,708
Sq Ft
$219/Sq Ft
Est. Value
About This Home
This home is located at 8938 W State Hwy, Bingham Canyon, UT 84006 and is currently estimated at $374,883, approximately $219 per square foot. 8938 W State Hwy is a home located in Salt Lake County with nearby schools including Copper Canyon School, Sunset Ridge Middle School, and Copper Hills High School.
Ownership History
Date
Name
Owned For
Owner Type
Purchase Details
Closed on
Nov 21, 2024
Sold by
Feidler Zachary and Hernandez Marelyn Meliza
Bought by
Crosland Nicholas E and Crosland Krista
Current Estimated Value
Home Financials for this Owner
Home Financials are based on the most recent Mortgage that was taken out on this home.
Original Mortgage
$22,092
Outstanding Balance
$21,880
Interest Rate
6.32%
Estimated Equity
$353,003
Purchase Details
Closed on
Apr 14, 2021
Sold by
Nerdin Amelia A
Bought by
Feidler Zachary Aaron
Purchase Details
Closed on
Apr 13, 2021
Sold by
Feidler Zachary Aaron
Bought by
Feidler Zachary and Hemandez Marelyn Meliza
Purchase Details
Closed on
Dec 12, 2001
Sold by
Arronco John and Arronco Amy M
Bought by
Arronco John
Home Financials for this Owner
Home Financials are based on the most recent Mortgage that was taken out on this home.
Original Mortgage
$40,000
Interest Rate
6.57%
Mortgage Type
Purchase Money Mortgage
Create a Home Valuation Report for This Property
The Home Valuation Report is an in-depth analysis detailing your home's value as well as a comparison with similar homes in the area
Home Values in the Area
Average Home Value in this Area
Purchase History
| Date | Buyer | Sale Price | Title Company |
|---|---|---|---|
| Crosland Nicholas E | -- | Chicago Title | |
| Feidler Zachary Aaron | -- | Gt Title Services Slc | |
| Feidler Zachary | -- | Accommodation | |
| Arronco John | -- | Equity Title |
Source: Public Records
Mortgage History
| Date | Status | Borrower | Loan Amount |
|---|---|---|---|
| Open | Crosland Nicholas E | $22,092 | |
| Open | Crosland Nicholas E | $368,207 | |
| Previous Owner | Arronco John | $40,000 |
Source: Public Records
Tax History Compared to Growth
Tax History
| Year | Tax Paid | Tax Assessment Tax Assessment Total Assessment is a certain percentage of the fair market value that is determined by local assessors to be the total taxable value of land and additions on the property. | Land | Improvement |
|---|---|---|---|---|
| 2025 | $1,855 | $360,300 | $82,900 | $277,400 |
| 2024 | $1,855 | $281,000 | $81,300 | $199,700 |
| 2023 | $1,855 | $259,900 | $78,200 | $181,700 |
| 2022 | $1,820 | $264,200 | $76,600 | $187,600 |
| 2021 | $1,451 | $193,300 | $60,500 | $132,800 |
| 2020 | $1,291 | $157,300 | $52,400 | $104,900 |
| 2019 | $1,216 | $148,900 | $52,400 | $96,500 |
| 2018 | $1,110 | $135,100 | $49,200 | $85,900 |
| 2017 | $1,034 | $124,800 | $49,200 | $75,600 |
| 2016 | $1,053 | $121,200 | $49,200 | $72,000 |
| 2015 | $1,030 | $115,200 | $58,700 | $56,500 |
| 2014 | $987 | $108,100 | $56,100 | $52,000 |
Source: Public Records
Map
Nearby Homes
- 8640 W State Hwy
- 1982 W 9325 S Unit 23
- 11174 S Fordman Way
- 11178 S Fordman Way
- 11184 S Fordman Way
- 7061 S Jordan Pkwy W
- 11188 S Fordman Way
- 11194 S Fordman Way
- 7059 S Jordan Pkwy W Unit 388
- 11204 S Fordman Way
- 11208 S Fordman Way
- 7051 S Jordan Pkwy W Unit 386
- 7043 S Jordan Pkwy W
- 7047 W Swansea Dr
- 7148 W Lake Ave
- 7046 W Swansea Dr
- 11184 S Easy Bee Rd Unit 265
- 7086 W Docksider Dr Unit 274
- 11192 S Easy Bee Rd Unit 262
- 11214 S Easy Bee Rd Unit 270
- 8946 W State Hwy
- 8952 W State Hwy
- 8922 W State Hwy Unit 5
- 8958 W State Hwy
- 8914 W State Hwy Unit 8916
- 8964 W State Hwy
- 8931 W State Hwy
- 8943 W State Hwy
- 8968 W State Hwy
- 8919 W Park St
- 8949 W State Hwy
- 8902 W State Hwy Unit 8904
- 8955 W State Hwy
- 8961 W State Hwy
- 10332 S Dinkeyville Way
- 8901 W Park St
- 8612 W 10200 S
- 8516 W 10200 S
- 8532 W 10200 S
- 8891 W State Hwy