Estimated Value: $428,000 - $491,756
4
Beds
2
Baths
1,728
Sq Ft
$266/Sq Ft
Est. Value
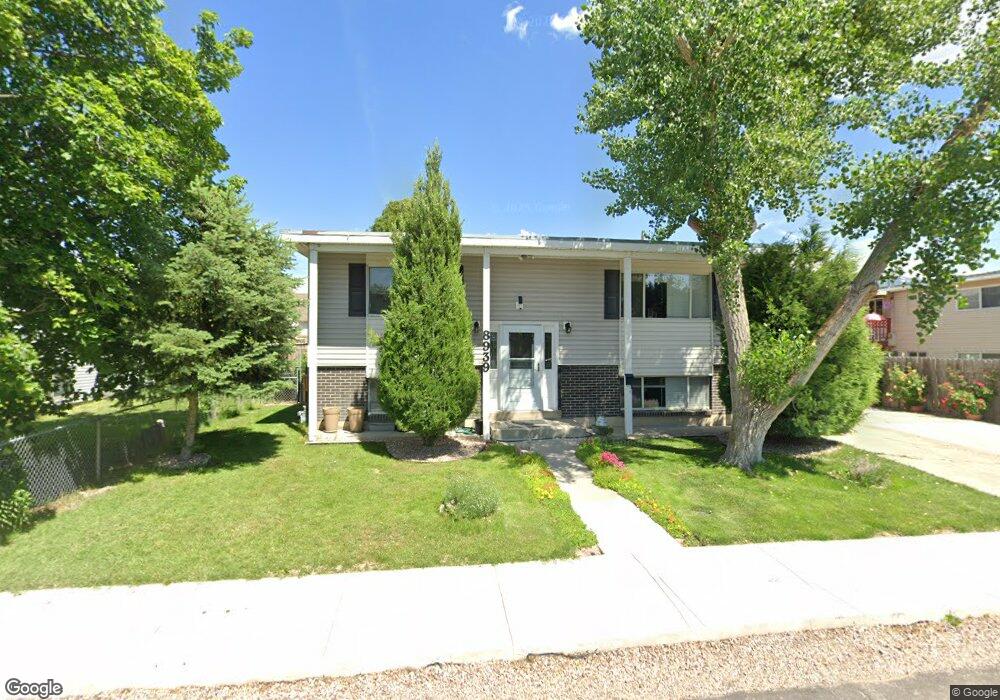
About This Home
This home is located at 8939 S 60 E, Sandy, UT 84070 and is currently estimated at $459,939, approximately $266 per square foot. 8939 S 60 E is a home located in Salt Lake County with nearby schools including Sandy Elementary School, Mount Jordan Middle School, and Jordan High.
Ownership History
Date
Name
Owned For
Owner Type
Purchase Details
Closed on
May 19, 2011
Sold by
Walker Michael R and Walker Coya P
Bought by
Pacheco Jorge
Current Estimated Value
Home Financials for this Owner
Home Financials are based on the most recent Mortgage that was taken out on this home.
Original Mortgage
$98,900
Outstanding Balance
$5,780
Interest Rate
4.04%
Mortgage Type
New Conventional
Estimated Equity
$454,159
Purchase Details
Closed on
Dec 20, 1996
Sold by
Walker Michael R
Bought by
Walker Michael R and Walker Coya P
Home Financials for this Owner
Home Financials are based on the most recent Mortgage that was taken out on this home.
Original Mortgage
$103,384
Interest Rate
7.59%
Mortgage Type
FHA
Purchase Details
Closed on
Jul 19, 1994
Sold by
Cowdell Arvella Kay
Bought by
Walker Michael R
Home Financials for this Owner
Home Financials are based on the most recent Mortgage that was taken out on this home.
Original Mortgage
$78,221
Interest Rate
8.25%
Mortgage Type
FHA
Create a Home Valuation Report for This Property
The Home Valuation Report is an in-depth analysis detailing your home's value as well as a comparison with similar homes in the area
Home Values in the Area
Average Home Value in this Area
Purchase History
| Date | Buyer | Sale Price | Title Company |
|---|---|---|---|
| Pacheco Jorge | -- | Paramount Title | |
| Walker Michael R | -- | -- | |
| Walker Michael R | -- | -- |
Source: Public Records
Mortgage History
| Date | Status | Borrower | Loan Amount |
|---|---|---|---|
| Open | Pacheco Jorge | $98,900 | |
| Previous Owner | Walker Michael R | $103,384 | |
| Previous Owner | Walker Michael R | $78,221 |
Source: Public Records
Tax History
| Year | Tax Paid | Tax Assessment Tax Assessment Total Assessment is a certain percentage of the fair market value that is determined by local assessors to be the total taxable value of land and additions on the property. | Land | Improvement |
|---|---|---|---|---|
| 2025 | $2,002 | $439,200 | $118,100 | $321,100 |
| 2024 | $2,002 | $370,200 | $108,300 | $261,900 |
| 2023 | $1,845 | $340,300 | $103,000 | $237,300 |
| 2022 | $1,968 | $354,500 | $101,000 | $253,500 |
| 2021 | $1,870 | $286,800 | $79,000 | $207,800 |
| 2020 | $1,759 | $254,300 | $79,000 | $175,300 |
| 2019 | $1,722 | $242,600 | $79,000 | $163,600 |
| 2016 | $1,250 | $169,400 | $56,900 | $112,500 |
Source: Public Records
Map
Nearby Homes
- 8558 S Center St
- 112 E 8680 S
- 181 E 9180 S
- 87 W 8710 S
- 136 W Freedom Ave Unit 136
- 270 E 8680 S
- 37 Crawford Place
- 140 W 8710 S
- 8812 S Stratford Cir
- 362 E 9150 S
- 412 E 8760 S
- 220 E Pioneer Ave
- 194 Pioneer Ave
- 140 Paula Dr
- 87 Pioneer Ave
- 149 E Pioneer Ave
- 8470 Solar Way
- 227 E St Germain Way
- 8459 S 300 E
- 487 E 9270 S
Your Personal Tour Guide
Ask me questions while you tour the home.