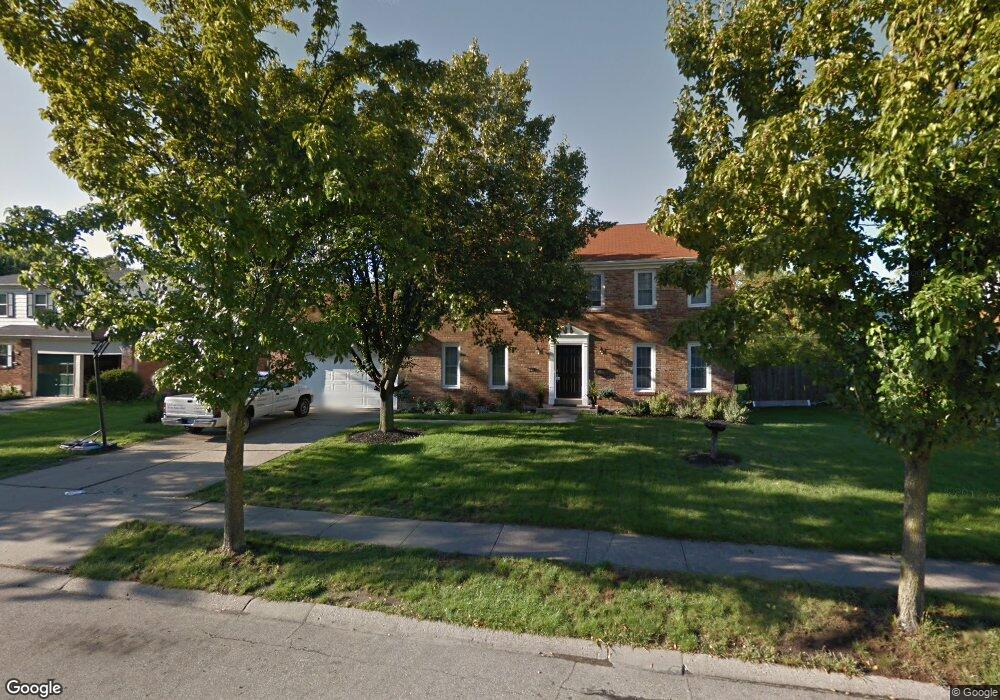
894 Clearfield Ln Cincinnati, OH 45240
Estimated Value: $301,000 - $343,000
4
Beds
3
Baths
2,400
Sq Ft
$135/Sq Ft
Est. Value
About This Home
This home is located at 894 Clearfield Ln, Cincinnati, OH 45240 and is currently estimated at $323,480, approximately $134 per square foot. 894 Clearfield Ln is a home located in Hamilton County with nearby schools including Springdale Elementary School, Princeton Community Middle School, and Princeton High School.
Ownership History
Date
Name
Owned For
Owner Type
Purchase Details
Closed on
Dec 20, 2006
Sold by
Denson Jimmy L and Denson Amanda L
Bought by
Deutsche Bank National Trust Co and Bankers Trust Co Of California Na
Current Estimated Value
Purchase Details
Closed on
Sep 22, 2006
Sold by
Deutsche Bank National Trust Co
Bought by
Hill Anthony and Hill Sabrena
Home Financials for this Owner
Home Financials are based on the most recent Mortgage that was taken out on this home.
Original Mortgage
$150,000
Interest Rate
6.27%
Mortgage Type
Unknown
Purchase Details
Closed on
Jul 30, 1999
Sold by
Patterson Wendell I and Patterson Joan E
Bought by
Denson Jimmy L and Denson Amanda L
Home Financials for this Owner
Home Financials are based on the most recent Mortgage that was taken out on this home.
Original Mortgage
$135,915
Interest Rate
7.68%
Create a Home Valuation Report for This Property
The Home Valuation Report is an in-depth analysis detailing your home's value as well as a comparison with similar homes in the area
Home Values in the Area
Average Home Value in this Area
Purchase History
| Date | Buyer | Sale Price | Title Company |
|---|---|---|---|
| Deutsche Bank National Trust Co | $158,465 | None Available | |
| Hill Anthony | $150,000 | Attorney | |
| Denson Jimmy L | $159,900 | -- |
Source: Public Records
Mortgage History
| Date | Status | Borrower | Loan Amount |
|---|---|---|---|
| Previous Owner | Hill Anthony | $150,000 | |
| Previous Owner | Denson Jimmy L | $135,915 |
Source: Public Records
Tax History
| Year | Tax Paid | Tax Assessment Tax Assessment Total Assessment is a certain percentage of the fair market value that is determined by local assessors to be the total taxable value of land and additions on the property. | Land | Improvement |
|---|---|---|---|---|
| 2025 | $4,311 | $85,929 | $13,675 | $72,254 |
| 2023 | $3,713 | $85,929 | $13,675 | $72,254 |
| 2022 | $3,226 | $60,715 | $11,452 | $49,263 |
| 2021 | $3,136 | $60,715 | $11,452 | $49,263 |
| 2020 | $3,176 | $60,715 | $11,452 | $49,263 |
| 2019 | $3,738 | $51,895 | $9,790 | $42,105 |
| 2018 | $2,765 | $51,895 | $9,790 | $42,105 |
| 2017 | $2,596 | $51,895 | $9,790 | $42,105 |
| 2016 | $2,604 | $51,692 | $10,227 | $41,465 |
| 2015 | $2,631 | $51,692 | $10,227 | $41,465 |
| 2014 | $2,639 | $51,692 | $10,227 | $41,465 |
| 2013 | $2,745 | $54,989 | $10,878 | $44,111 |
Source: Public Records
Map
Nearby Homes
- 3311 Greenwich Dr
- 3323 Devonian Dr
- 3518 Danbury Rd
- 993 Havensport Dr
- 805 Halesworth Dr
- 3 S Applewood Ct
- 11839 Hamlet Rd
- 27 Wildwood Dr Unit 179
- 11833 Fairsprings Ct
- 13 Caribou Ct
- 15 Applewood Dr
- 65 Twin Lakes Dr
- 126 Chapel Hill Dr Unit 126
- 124 Chapel Hill Dr Unit 124
- 96 Twin Lakes Dr
- 1 Saint James Ct Unit 47
- 11639 Hanover Rd
- 3700 Mack Rd
- 694 Park Ave
- 1 Darby Ct
- 898 Clearfield Ln
- 890 Clearfield Ln
- 3261 Greenwich Dr
- 902 Clearfield Ln
- 886 Clearfield Ln
- 3271 Greenwich Dr
- 895 Clearfield Ln
- 891 Clearfield Ln
- 3249 Greenwich Dr
- 899 Clearfield Ln
- 887 Clearfield Ln
- 906 Clearfield Ln
- 882 Clearfield Ln
- 3291 Greenwich Dr
- 883 Clearfield Ln
- 878 Clearfield Ln
- 912 Clearfield Ln
- 909 Clearfield Ln
- 894 Yorkhaven Rd
- 890 Yorkhaven Rd
Your Personal Tour Guide
Ask me questions while you tour the home.