Estimated Value: $47,000 - $78,000
2
Beds
1
Bath
784
Sq Ft
$81/Sq Ft
Est. Value
About This Home
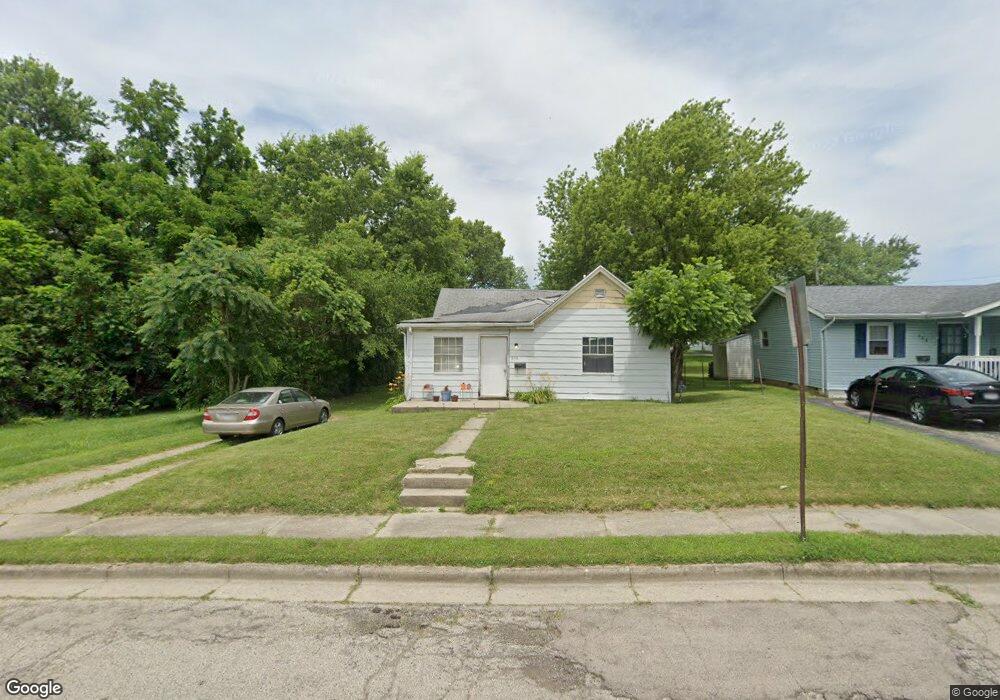
This home is located at 894 E 3rd St, Xenia, OH 45385 and is currently estimated at $63,120, approximately $80 per square foot. 894 E 3rd St is a home located in Greene County with nearby schools including Xenia High School, Summit Academy Community School for Alternative Learners - Xenia, and Legacy Christian Academy.
Ownership History
Date
Name
Owned For
Owner Type
Purchase Details
Closed on
Oct 2, 2002
Sold by
Henize Mary Jane
Bought by
Henize James E
Current Estimated Value
Purchase Details
Closed on
Apr 14, 2000
Sold by
Henize James E
Bought by
Henize James E and Henize Mary Jane
Purchase Details
Closed on
Apr 7, 2000
Sold by
Ferrell Raymond E
Bought by
Henize James E
Purchase Details
Closed on
Feb 3, 1998
Sold by
Ferrell Clarence V and Ferrell Patricia Jane
Bought by
Ferrell Raymond F and Ferrell Jennifer L
Purchase Details
Closed on
Sep 6, 1995
Sold by
Goins Willmore
Bought by
Ferrell Clarence V and Ferrell J
Create a Home Valuation Report for This Property
The Home Valuation Report is an in-depth analysis detailing your home's value as well as a comparison with similar homes in the area
Home Values in the Area
Average Home Value in this Area
Purchase History
| Date | Buyer | Sale Price | Title Company |
|---|---|---|---|
| Henize James E | -- | -- | |
| Henize James E | -- | -- | |
| Henize James E | $20,100 | -- | |
| Henize James E | $20,100 | -- | |
| Ferrell Raymond F | -- | -- | |
| Ferrell Clarence V | $23,000 | -- |
Source: Public Records
Tax History Compared to Growth
Tax History
| Year | Tax Paid | Tax Assessment Tax Assessment Total Assessment is a certain percentage of the fair market value that is determined by local assessors to be the total taxable value of land and additions on the property. | Land | Improvement |
|---|---|---|---|---|
| 2024 | $360 | $8,420 | $2,380 | $6,040 |
| 2023 | $360 | $8,420 | $2,380 | $6,040 |
| 2022 | $319 | $6,350 | $2,170 | $4,180 |
| 2021 | $323 | $6,350 | $2,170 | $4,180 |
| 2020 | $309 | $6,350 | $2,170 | $4,180 |
| 2019 | $302 | $5,830 | $2,290 | $3,540 |
| 2018 | $303 | $5,830 | $2,290 | $3,540 |
| 2017 | $294 | $5,830 | $2,290 | $3,540 |
| 2016 | $299 | $5,650 | $2,290 | $3,360 |
| 2015 | $300 | $5,650 | $2,290 | $3,360 |
| 2014 | $287 | $5,650 | $2,290 | $3,360 |
Source: Public Records
Map
Nearby Homes
- 654 E 3rd St
- 0 N Patton St
- 00 N Patton St
- 607 E Main St
- 645 E Church St
- 612 E Market St
- 541 E Main St
- 1293 E Main St
- 240 E 2nd St
- 373 Hill St
- 568 Louise Dr
- 348 S Stadium Dr
- 479 N Stadium Dr
- 222 Washington St
- 0 Gultice Rd Unit 940427
- 610 Saxony Dr
- 656 Eden Roc Dr
- 508 Marshall Dr
- 36 Leaman St
- 119 Park Dr