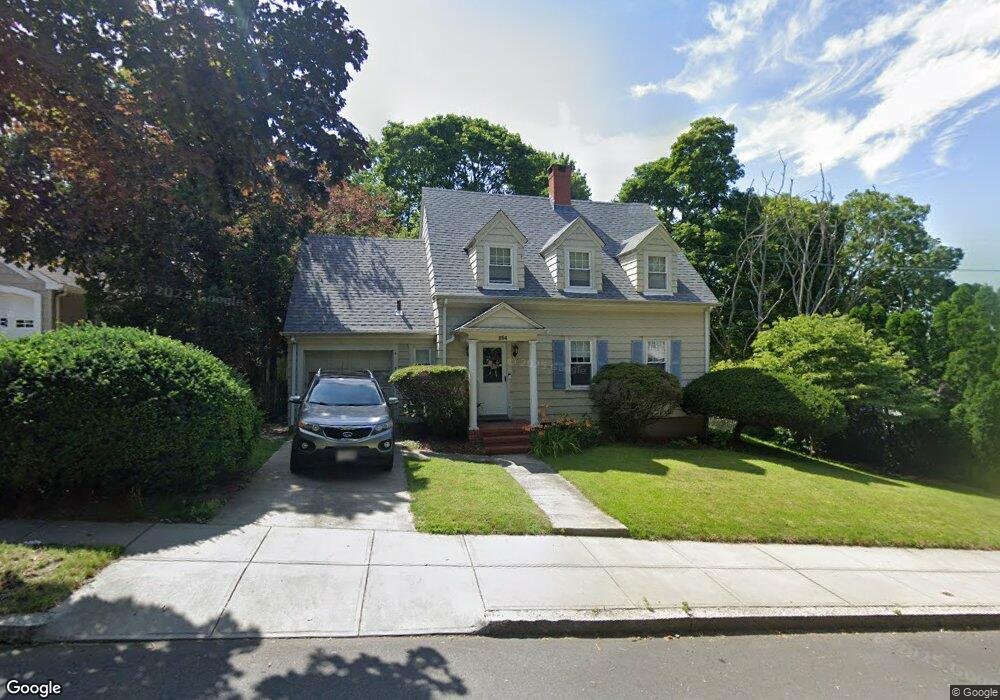
894 High St Fall River, MA 02720
Lower Highlands NeighborhoodEstimated Value: $414,000 - $488,000
3
Beds
2
Baths
1,502
Sq Ft
$293/Sq Ft
Est. Value
About This Home
This home is located at 894 High St, Fall River, MA 02720 and is currently estimated at $439,594, approximately $292 per square foot. 894 High St is a home located in Bristol County with nearby schools including Mary Fonseca Elementary School, Morton Middle School, and B M C Durfee High School.
Ownership History
Date
Name
Owned For
Owner Type
Purchase Details
Closed on
Aug 30, 2001
Sold by
Kiley Mary Catherine
Bought by
Washington Diane M and Washington Anthony S
Current Estimated Value
Home Financials for this Owner
Home Financials are based on the most recent Mortgage that was taken out on this home.
Original Mortgage
$164,350
Interest Rate
7.06%
Mortgage Type
Purchase Money Mortgage
Purchase Details
Closed on
Aug 11, 1995
Sold by
Ramsay Kenneth R and Edwards Karen M
Bought by
Kiley Mary Catherine
Create a Home Valuation Report for This Property
The Home Valuation Report is an in-depth analysis detailing your home's value as well as a comparison with similar homes in the area
Home Values in the Area
Average Home Value in this Area
Purchase History
| Date | Buyer | Sale Price | Title Company |
|---|---|---|---|
| Washington Diane M | $173,000 | -- | |
| Kiley Mary Catherine | $105,000 | -- |
Source: Public Records
Mortgage History
| Date | Status | Borrower | Loan Amount |
|---|---|---|---|
| Open | Kiley Mary Catherine | $220,000 | |
| Closed | Kiley Mary Catherine | $187,500 | |
| Closed | Kiley Mary Catherine | $164,350 | |
| Previous Owner | Kiley Mary Catherine | $110,900 |
Source: Public Records
Tax History
| Year | Tax Paid | Tax Assessment Tax Assessment Total Assessment is a certain percentage of the fair market value that is determined by local assessors to be the total taxable value of land and additions on the property. | Land | Improvement |
|---|---|---|---|---|
| 2025 | $3,993 | $348,700 | $120,400 | $228,300 |
| 2024 | $3,803 | $331,000 | $118,000 | $213,000 |
| 2023 | $3,838 | $312,800 | $106,300 | $206,500 |
| 2022 | $3,447 | $273,100 | $100,300 | $172,800 |
| 2021 | $3,296 | $238,300 | $95,800 | $142,500 |
| 2020 | $3,092 | $214,000 | $91,500 | $122,500 |
| 2019 | $3,120 | $214,000 | $95,600 | $118,400 |
| 2018 | $3,064 | $209,600 | $94,000 | $115,600 |
| 2017 | $2,905 | $207,500 | $94,000 | $113,500 |
| 2016 | $2,819 | $206,800 | $99,000 | $107,800 |
| 2015 | $2,705 | $206,800 | $99,000 | $107,800 |
| 2014 | $2,602 | $206,800 | $99,000 | $107,800 |
Source: Public Records
Map
Nearby Homes
- 889 High St
- 909 High St Unit 1
- 267 Lincoln Ave
- 11 Dyer St
- 72 Belmont St
- 327 Brownell St
- 503 Highland Ave
- 33-35 Malvey St
- 499 Hanover St
- 10 N Court St Unit 3
- 575 N Main St
- 302 Cory St
- 750 Davol St Unit 219
- 750 Davol St Unit 221
- 750 Davol St Unit 616
- 750 Davol St Unit 214
- 301 Madison St
- 213 Weetamoe St
- 65 Bigelow St
- 499 Maple St
Your Personal Tour Guide
Ask me questions while you tour the home.