
Landlord's Agent in 2024
Alina Wang
Coldwell Banker Realty - Lexington
(617) 678-2405
257 Total Sales

Estimated Value: $703,875 - $744,000
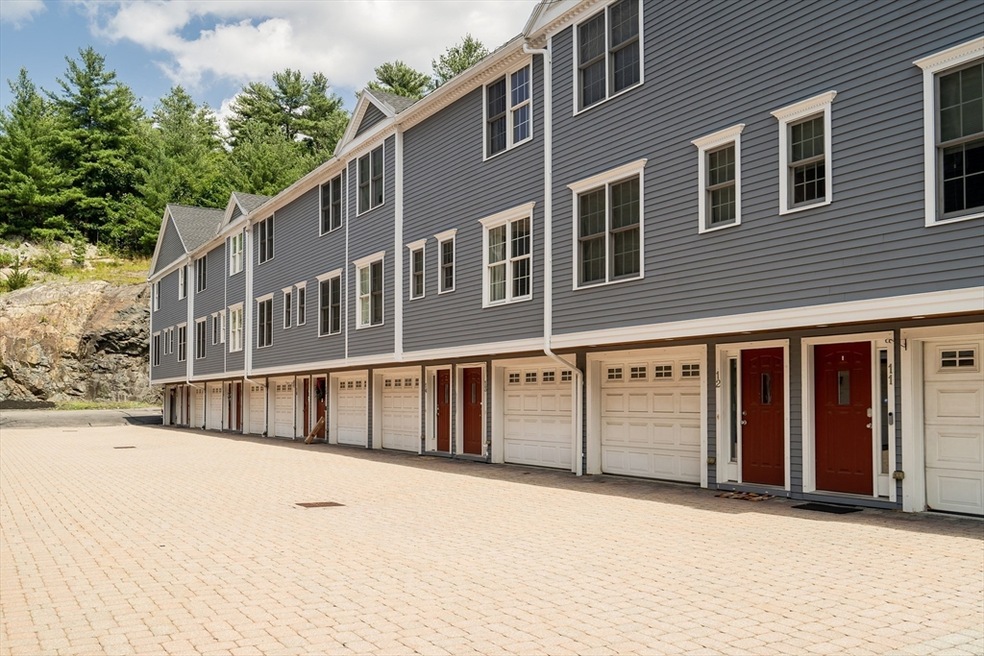
Prime Commuter Location! This luxurious townhome steps from Greenwood MBTA, with bus stop to Oak Grove T station right outside. Enter into a breathtaking open-concept living space boasting stunning hardwood floors, elegant crown moldings, recessed lighting, and lofty 9-foot ceilings. The chef's kitchen, complete with a breakfast bar and slider leading to a private patio, is perfect for both casual mornings and entertaining. Host unforgettable dinner parties in the generously sized dining room. Upstairs, discover two bedrooms and two full baths, including a master bedroom featuring an en-suite bath with dual sinks and a luxurious jetted soaker tub. Laundry on this floor. Ascend to the top floor and find a versatile space with a vaulted ceiling and skylight, ideal for use as a guest suite, home office, or family room. Two-car garage, with add’l deeded spot, ample closet space and central AC. Professionally managed year round (incl snow removal). Some pet restrictions apply - ask agent.
| Date | Buyer | Sale Price | Title Company |
|---|---|---|---|
| Zheng Jiahui | $585,000 | None Available |
| Date | Status | Borrower | Loan Amount |
|---|---|---|---|
| Open | Zheng Jiahui | $468,000 |
| Date | Event | Price | List to Sale | Price per Sq Ft | Prior Sale |
|---|---|---|---|---|---|
| 08/23/2024 08/23/24 | Rented | $3,800 | 0.0% | -- | |
| 08/02/2024 08/02/24 | Under Contract | -- | -- | -- | |
| 07/22/2024 07/22/24 | For Rent | $3,800 | 0.0% | -- | |
| 08/18/2023 08/18/23 | Rented | $3,800 | 0.0% | -- | |
| 08/16/2023 08/16/23 | Off Market | $3,800 | -- | -- | |
| 05/20/2023 05/20/23 | For Rent | $3,800 | 0.0% | -- | |
| 04/28/2022 04/28/22 | Sold | $585,000 | -2.5% | $312 / Sq Ft | View Prior Sale |
| 02/28/2022 02/28/22 | Pending | -- | -- | -- | |
| 02/17/2022 02/17/22 | For Sale | $599,900 | -- | $320 / Sq Ft |
| Year | Tax Paid | Tax Assessment Tax Assessment Total Assessment is a certain percentage of the fair market value that is determined by local assessors to be the total taxable value of land and additions on the property. | Land | Improvement |
|---|---|---|---|---|
| 2025 | $7,022 | $618,700 | $0 | $618,700 |
| 2024 | $6,219 | $552,800 | $0 | $552,800 |
| 2023 | $6,226 | $530,800 | $0 | $530,800 |
| 2022 | $6,314 | $512,500 | $0 | $512,500 |
| 2021 | $6,095 | $478,800 | $0 | $478,800 |
| 2020 | $6,114 | $478,800 | $0 | $478,800 |
| 2019 | $5,709 | $445,000 | $0 | $445,000 |
| 2018 | $5,167 | $399,000 | $0 | $399,000 |
| 2017 | $5,000 | $383,700 | $0 | $383,700 |
| 2016 | $4,939 | $366,100 | $0 | $366,100 |
| 2015 | $4,745 | $352,000 | $0 | $352,000 |
| 2014 | $4,389 | $343,400 | $0 | $343,400 |
Landlord's Agent in 2024
Alina Wang
Coldwell Banker Realty - Lexington
(617) 678-2405
257 Total Sales
Landlord's Co-Listing Agent in 2024
Lin Zhu
Coldwell Banker Realty - Lexington
(339) 203-7199
90 Total Sales
Seller's Agent in 2023
Rebecca Huang
William Raveis R.E. & Home Services
(617) 888-0018
1 in this area
312 Total Sales
H
Seller's Agent in 2022
Homegrown Realty Team
Citylight Homes LLC
1 in this area
40 Total Sales
C
Buyer's Agent in 2022
Chi Zhang
FlyHomes Brokerage LLC
Source: MLS Property Information Network (MLS PIN)
MLS Number: 73267746
APN: WAKE-000022-001581-000043A-000013
Disclaimer: Certain information contained herein is derived from information provided by parties other than Homes.com. All information provided is deemed reliable, but is not guaranteed to be accurate and should be independently verified.
![]() The property listing data and information, or the Images, set forth herein were provided to MLS Property Information Network, Inc. from third party sources, including sellers, lessors and public records, and were compiled by MLS Property Information Network, Inc. The property listing data and information, and the Images, are for the personal, non-commercial use of consumers having a good faith interest in purchasing or leasing listed properties of the type displayed to them and may not be used for any purpose other than to identify prospective properties which such consumers may have a good faith interest in purchasing or leasing. MLS Property Information Network, Inc. and its subscribers disclaim any and all representations and warranties as to the accuracy of the property listing data and information, or as to the accuracy of any of the Images, set forth herein.
The property listing data and information, or the Images, set forth herein were provided to MLS Property Information Network, Inc. from third party sources, including sellers, lessors and public records, and were compiled by MLS Property Information Network, Inc. The property listing data and information, and the Images, are for the personal, non-commercial use of consumers having a good faith interest in purchasing or leasing listed properties of the type displayed to them and may not be used for any purpose other than to identify prospective properties which such consumers may have a good faith interest in purchasing or leasing. MLS Property Information Network, Inc. and its subscribers disclaim any and all representations and warranties as to the accuracy of the property listing data and information, or as to the accuracy of any of the Images, set forth herein.
Ask me questions while you tour the home.