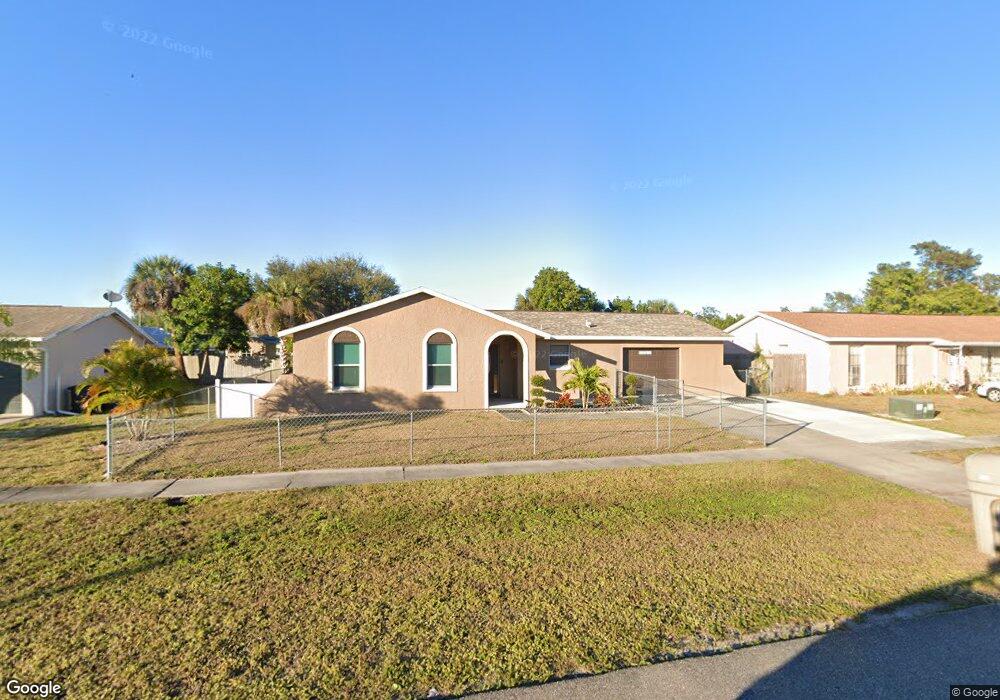
894 Ridgeway Dr North Fort Myers, FL 33903
Hancock NeighborhoodEstimated Value: $258,719 - $312,000
3
Beds
2
Baths
1,627
Sq Ft
$171/Sq Ft
Est. Value
About This Home
This home is located at 894 Ridgeway Dr, North Fort Myers, FL 33903 and is currently estimated at $277,430, approximately $170 per square foot. 894 Ridgeway Dr is a home located in Lee County with nearby schools including Tropic Isles Elementary School, Hancock Creek Elementary School, and Caloosa Elementary School.
Ownership History
Date
Name
Owned For
Owner Type
Purchase Details
Closed on
May 6, 2014
Sold by
Olivo Tonesa E and Olivo Luis E
Bought by
Olivo Tonesa E
Current Estimated Value
Home Financials for this Owner
Home Financials are based on the most recent Mortgage that was taken out on this home.
Original Mortgage
$102,500
Outstanding Balance
$31,550
Interest Rate
4.37%
Mortgage Type
New Conventional
Estimated Equity
$245,880
Purchase Details
Closed on
Jul 3, 2002
Sold by
1St Union Natl Bk Of De
Bought by
Crowder Tonesa
Home Financials for this Owner
Home Financials are based on the most recent Mortgage that was taken out on this home.
Original Mortgage
$80,900
Interest Rate
6.79%
Purchase Details
Closed on
Oct 24, 2000
Sold by
Wall Edward M
Bought by
Rogers Mark and Aylesworth Denise
Home Financials for this Owner
Home Financials are based on the most recent Mortgage that was taken out on this home.
Original Mortgage
$67,500
Interest Rate
7.93%
Create a Home Valuation Report for This Property
The Home Valuation Report is an in-depth analysis detailing your home's value as well as a comparison with similar homes in the area
Home Values in the Area
Average Home Value in this Area
Purchase History
| Date | Buyer | Sale Price | Title Company |
|---|---|---|---|
| Olivo Tonesa E | -- | Servicelink | |
| Crowder Tonesa | $80,900 | -- | |
| Rogers Mark | $75,000 | -- |
Source: Public Records
Mortgage History
| Date | Status | Borrower | Loan Amount |
|---|---|---|---|
| Open | Olivo Tonesa E | $102,500 | |
| Closed | Crowder Tonesa | $80,900 | |
| Previous Owner | Rogers Mark | $67,500 |
Source: Public Records
Tax History Compared to Growth
Tax History
| Year | Tax Paid | Tax Assessment Tax Assessment Total Assessment is a certain percentage of the fair market value that is determined by local assessors to be the total taxable value of land and additions on the property. | Land | Improvement |
|---|---|---|---|---|
| 2025 | $617 | $45,269 | -- | -- |
| 2024 | $582 | $43,993 | -- | -- |
| 2023 | $582 | $42,712 | $0 | $0 |
| 2022 | $658 | $41,468 | $0 | $0 |
| 2021 | $594 | $134,170 | $21,811 | $112,359 |
| 2020 | $584 | $39,704 | $0 | $0 |
| 2019 | $560 | $38,811 | $0 | $0 |
| 2018 | $552 | $38,087 | $0 | $0 |
| 2017 | $538 | $37,304 | $0 | $0 |
| 2016 | $480 | $76,455 | $7,679 | $68,776 |
| 2015 | $472 | $64,609 | $6,634 | $57,975 |
| 2014 | -- | $63,893 | $6,602 | $57,291 |
| 2013 | -- | $55,801 | $4,982 | $50,819 |
Source: Public Records
Map
Nearby Homes
- 888 Ridgeway Dr
- 1010 Tropic Terrace
- 1003 Tropic Terrace
- 1429 Tropic Terrace
- 1409 Tropic Terrace
- 935 Hearty St
- 1432 Tropic Terrace Unit PS32
- 1416 Tropic Terrace
- 1418 Tropic Terrace
- 0 Happy Dale Rd Unit 2025008482
- 1517 Tropic Terrace
- 1521 Tropic Terrace
- 1525 Tropic Terrace Unit 1500
- 1507 Tropic Terrace
- 1516 Tropic Terrace
- 1503 Tropic Terrace
- 1512 Tropic Terrace
- 1515 Tropic Terrace Unit 1515
- 857 Pangola Dr
- 947 Jolly Rd
- 900 Ridgeway Dr
- 900 Ridge Rd
- 764 Friendly St
- 882 Ridgeway Dr
- 893 Ridgeway Dr
- 770 Friendly St
- 887 Ridgeway Dr
- 899 Ridgeway Dr
- 881 Ridgeway Dr
- 876 Ridgeway Dr
- 905 Ridgeway Dr
- 776 Friendly St
- 912 Ridgeway Dr
- 911 Happy Rd
- 875 Ridgeway Dr
- 911 Ridgeway Dr
- 782 Friendly St
- 918 Ridgeway Dr
- 917 Happy Rd
- 917 Ridgeway Dr