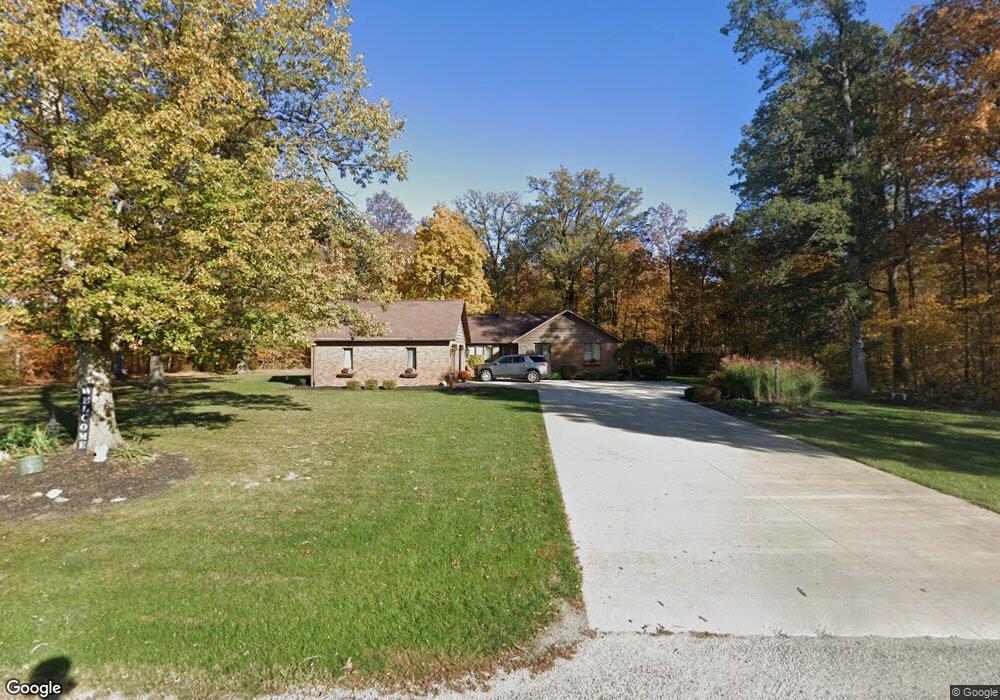
8940 Brandewie Rd Fort Loramie, OH 45845
Estimated Value: $277,000 - $603,000
3
Beds
2
Baths
2,805
Sq Ft
$164/Sq Ft
Est. Value
About This Home
This home is located at 8940 Brandewie Rd, Fort Loramie, OH 45845 and is currently estimated at $461,129, approximately $164 per square foot. 8940 Brandewie Rd is a home located in Shelby County with nearby schools including Fort Loramie Elementary School and Fort Loramie Junior/Senior High School.
Ownership History
Date
Name
Owned For
Owner Type
Purchase Details
Closed on
Jun 28, 2022
Sold by
Courtney Iii William E and Courtney Stacie J
Bought by
Riethman Jeanette S
Current Estimated Value
Home Financials for this Owner
Home Financials are based on the most recent Mortgage that was taken out on this home.
Original Mortgage
$418,000
Outstanding Balance
$397,679
Interest Rate
5.09%
Mortgage Type
New Conventional
Estimated Equity
$63,450
Purchase Details
Closed on
Apr 22, 2010
Sold by
Courtney Stacie J and Courtney William E
Bought by
Courtney William E and Courtney Stacie J
Home Financials for this Owner
Home Financials are based on the most recent Mortgage that was taken out on this home.
Original Mortgage
$129,900
Interest Rate
5.01%
Mortgage Type
New Conventional
Create a Home Valuation Report for This Property
The Home Valuation Report is an in-depth analysis detailing your home's value as well as a comparison with similar homes in the area
Home Values in the Area
Average Home Value in this Area
Purchase History
| Date | Buyer | Sale Price | Title Company |
|---|---|---|---|
| Riethman Jeanette S | $440,000 | None Listed On Document | |
| Courtney William E | -- | Attorney |
Source: Public Records
Mortgage History
| Date | Status | Borrower | Loan Amount |
|---|---|---|---|
| Open | Riethman Jeanette S | $418,000 | |
| Previous Owner | Courtney William E | $129,900 |
Source: Public Records
Tax History Compared to Growth
Tax History
| Year | Tax Paid | Tax Assessment Tax Assessment Total Assessment is a certain percentage of the fair market value that is determined by local assessors to be the total taxable value of land and additions on the property. | Land | Improvement |
|---|---|---|---|---|
| 2024 | $3,155 | $92,000 | $14,610 | $77,390 |
| 2023 | $3,155 | $92,000 | $14,610 | $77,390 |
| 2022 | $2,596 | $69,860 | $11,830 | $58,030 |
| 2021 | $2,624 | $69,860 | $11,830 | $58,030 |
| 2020 | $2,624 | $69,860 | $11,830 | $58,030 |
| 2019 | $2,377 | $63,820 | $9,660 | $54,160 |
| 2018 | $2,318 | $63,820 | $9,660 | $54,160 |
| 2017 | $2,333 | $63,820 | $9,660 | $54,160 |
| 2016 | $2,147 | $57,530 | $7,880 | $49,650 |
| 2015 | $2,128 | $57,530 | $7,880 | $49,650 |
| 2014 | $2,128 | $57,530 | $7,880 | $49,650 |
| 2013 | $2,061 | $51,550 | $7,880 | $43,670 |
Source: Public Records
Map
Nearby Homes