Estimated Value: $635,000 - $724,000
5
Beds
3
Baths
3,092
Sq Ft
$214/Sq Ft
Est. Value
About This Home
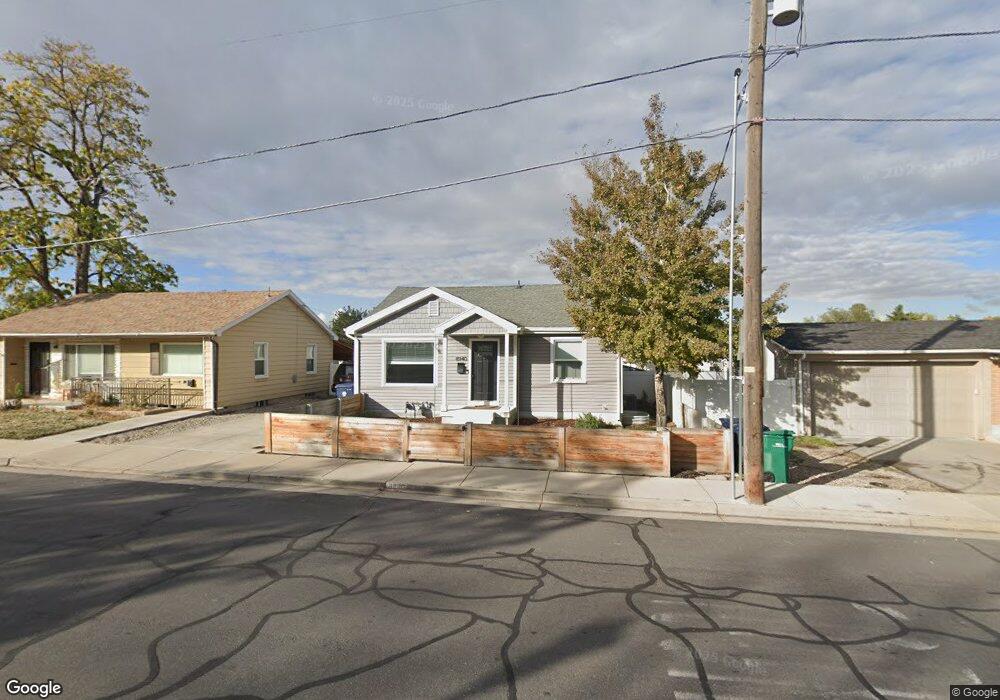
This home is located at 8940 S 280 E, Sandy, UT 84070 and is currently estimated at $661,365, approximately $213 per square foot. 8940 S 280 E is a home located in Salt Lake County with nearby schools including Sandy Elementary School, Mount Jordan Middle School, and Jordan High.
Ownership History
Date
Name
Owned For
Owner Type
Purchase Details
Closed on
Mar 9, 2022
Sold by
Valerie Gillies
Bought by
Sedlock Jordan and Sedlock Madison
Current Estimated Value
Home Financials for this Owner
Home Financials are based on the most recent Mortgage that was taken out on this home.
Original Mortgage
$504,000
Outstanding Balance
$470,898
Interest Rate
3.92%
Mortgage Type
New Conventional
Estimated Equity
$190,467
Purchase Details
Closed on
Jan 2, 2020
Sold by
Gillies Valerie
Bought by
Gillies Valerie and Taggart Shaun S
Purchase Details
Closed on
Feb 3, 2017
Sold by
Robin Son Investments Llc
Bought by
Gilles Walerie
Home Financials for this Owner
Home Financials are based on the most recent Mortgage that was taken out on this home.
Original Mortgage
$278,266
Interest Rate
3.5%
Mortgage Type
FHA
Purchase Details
Closed on
Jan 6, 2015
Sold by
Robinson James B and Robinson Mareen G
Bought by
Robinson Investments Llc
Home Financials for this Owner
Home Financials are based on the most recent Mortgage that was taken out on this home.
Original Mortgage
$260,316
Interest Rate
3.92%
Mortgage Type
VA
Purchase Details
Closed on
Dec 11, 2014
Sold by
Robinson Investments Llc
Bought by
Robinson James B and Robinson Mareen G
Home Financials for this Owner
Home Financials are based on the most recent Mortgage that was taken out on this home.
Original Mortgage
$260,316
Interest Rate
3.92%
Mortgage Type
VA
Purchase Details
Closed on
Sep 16, 2014
Sold by
Robinson James B and Robinson Mareen
Bought by
Robinson Investments Llc
Purchase Details
Closed on
Nov 15, 2013
Sold by
Rigby Rulon J and Rigby Connie Jill
Bought by
Robinson James B and Robinson Mareen
Home Financials for this Owner
Home Financials are based on the most recent Mortgage that was taken out on this home.
Original Mortgage
$164,461
Interest Rate
4.17%
Mortgage Type
VA
Purchase Details
Closed on
Sep 3, 2008
Sold by
Rigby Melvin W
Bought by
Rigby Melvin W
Purchase Details
Closed on
Oct 4, 2004
Sold by
Rigby Melvin W and Rigby Rita V
Bought by
Rigby Melvin W
Home Financials for this Owner
Home Financials are based on the most recent Mortgage that was taken out on this home.
Original Mortgage
$50,000
Interest Rate
5.77%
Mortgage Type
New Conventional
Create a Home Valuation Report for This Property
The Home Valuation Report is an in-depth analysis detailing your home's value as well as a comparison with similar homes in the area
Home Values in the Area
Average Home Value in this Area
Purchase History
| Date | Buyer | Sale Price | Title Company |
|---|---|---|---|
| Sedlock Jordan | -- | Titan Title Insurance Agency I | |
| Gillies Valerie | -- | Accommodation | |
| Gilles Walerie | -- | Titan Title Ins Agency Inc | |
| Robinson Investments Llc | -- | Titan Title Ins Agcy Inc | |
| Robinson James B | -- | Titan Title Ins Agcy Inc | |
| Robinson Investments Llc | -- | Founders Title | |
| Robinson James B | -- | First American Title | |
| Rigby Melvin W | -- | Accommodation | |
| Rigby Melvin W | -- | Cpr Title Ins Agency |
Source: Public Records
Mortgage History
| Date | Status | Borrower | Loan Amount |
|---|---|---|---|
| Open | Sedlock Jordan | $504,000 | |
| Previous Owner | Gilles Walerie | $278,266 | |
| Previous Owner | Robinson Investments Llc | $260,316 | |
| Previous Owner | Robinson James B | $164,461 | |
| Previous Owner | Rigby Melvin W | $50,000 |
Source: Public Records
Tax History
| Year | Tax Paid | Tax Assessment Tax Assessment Total Assessment is a certain percentage of the fair market value that is determined by local assessors to be the total taxable value of land and additions on the property. | Land | Improvement |
|---|---|---|---|---|
| 2025 | $3,315 | $666,400 | $122,000 | $544,400 |
| 2024 | $3,315 | $613,100 | $111,900 | $501,200 |
| 2023 | $2,895 | $533,900 | $101,100 | $432,800 |
| 2022 | $2,571 | $463,100 | $99,100 | $364,000 |
| 2021 | $2,496 | $382,700 | $77,500 | $305,200 |
| 2020 | $2,266 | $327,600 | $77,500 | $250,100 |
| 2019 | $2,173 | $306,200 | $77,500 | $228,700 |
| 2016 | $1,919 | $260,000 | $55,800 | $204,200 |
Source: Public Records
Map
Nearby Homes
- 412 E 8760 S
- 362 E 9150 S
- 270 E 8680 S
- 8558 S Center St
- 112 E 8680 S
- 8732 S 620 E
- 487 E 9270 S
- 220 E Pioneer Ave
- 194 Pioneer Ave
- 149 E Pioneer Ave
- 627 E 8680 S
- 8459 S 300 E
- 87 Pioneer Ave
- 227 E St Germain Way
- 37 Crawford Place
- 8470 Solar Way
- 87 W 8710 S
- 8797 Green Way Unit 3
- 8729 S Leafwood Ln
- 8722 S Oakwood Park Cir
- 8950 S 280 E
- 8930 S 280 E
- 8949 S 250 E
- 8933 S 250 E
- 8943 S 250 E
- 8951 S 280 E
- 8931 S 280 E
- 8970 S 280 E
- 262 E 8960 S
- 8908 S 280 E
- 8969 S 280 E
- 8938 S 250 E
- 8907 S 250 E
- 244 E 8920 S
- 8948 S 250 E
- 8909 S 280 E
- 319 E 8920 S
- 8040 S Mill Grove Ln Unit 102
- 243 E Hammermill Ln
- 8057 S Mill Grove Ln Unit 114
Your Personal Tour Guide
Ask me questions while you tour the home.