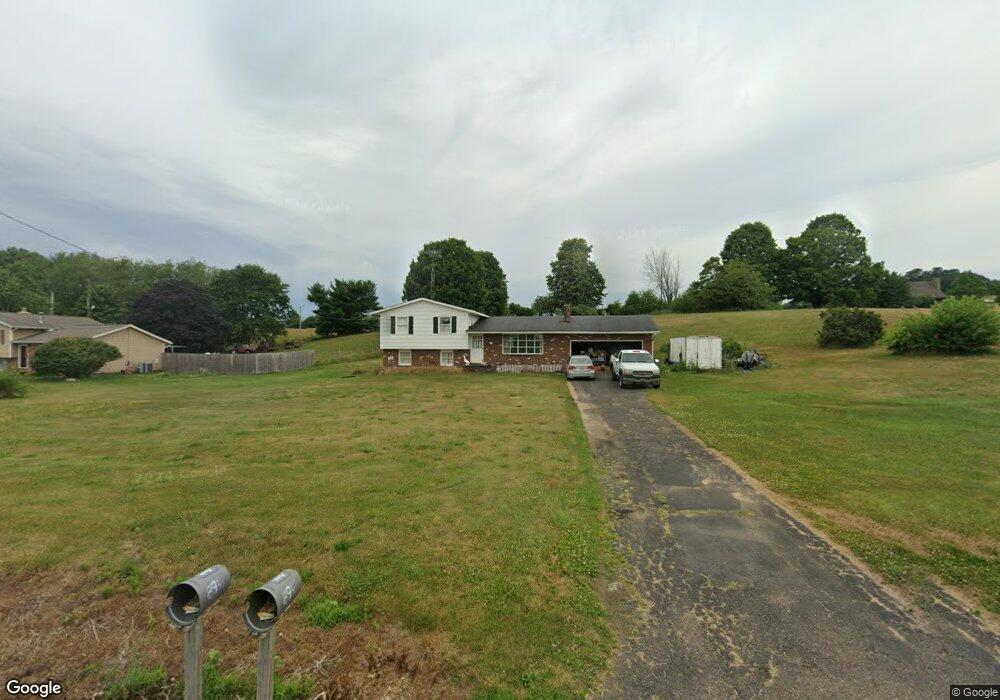
8941 Mapleton St SE East Canton, OH 44730
Estimated Value: $96,000 - $167,000
3
Beds
1
Bath
1,144
Sq Ft
$123/Sq Ft
Est. Value
About This Home
This home is located at 8941 Mapleton St SE, East Canton, OH 44730 and is currently estimated at $141,039, approximately $123 per square foot. 8941 Mapleton St SE is a home located in Stark County with nearby schools including East Canton Elementary School, East Canton Middle School, and East Canton High School.
Ownership History
Date
Name
Owned For
Owner Type
Purchase Details
Closed on
Oct 29, 2010
Sold by
Reed David E and Reed Sheila J
Bought by
Krider Robert
Current Estimated Value
Home Financials for this Owner
Home Financials are based on the most recent Mortgage that was taken out on this home.
Original Mortgage
$82,000
Outstanding Balance
$53,881
Interest Rate
4.19%
Mortgage Type
Seller Take Back
Estimated Equity
$87,158
Purchase Details
Closed on
May 28, 2002
Sold by
Krider Robert Edward
Bought by
Reed David
Home Financials for this Owner
Home Financials are based on the most recent Mortgage that was taken out on this home.
Original Mortgage
$105,600
Interest Rate
7%
Purchase Details
Closed on
Jan 18, 2000
Sold by
Krider Dorothy D
Bought by
Krider Dorothy E and Krider David R
Create a Home Valuation Report for This Property
The Home Valuation Report is an in-depth analysis detailing your home's value as well as a comparison with similar homes in the area
Home Values in the Area
Average Home Value in this Area
Purchase History
| Date | Buyer | Sale Price | Title Company |
|---|---|---|---|
| Krider Robert | $82,000 | Attorney | |
| Reed David | -- | Americas Choice Title Agency | |
| Krider Dorothy E | -- | Americas Choice Title Agency | |
| Krider Robert E | -- | Americas Choice Title Agency |
Source: Public Records
Mortgage History
| Date | Status | Borrower | Loan Amount |
|---|---|---|---|
| Open | Krider Robert | $82,000 | |
| Previous Owner | Reed David | $105,600 |
Source: Public Records
Tax History Compared to Growth
Tax History
| Year | Tax Paid | Tax Assessment Tax Assessment Total Assessment is a certain percentage of the fair market value that is determined by local assessors to be the total taxable value of land and additions on the property. | Land | Improvement |
|---|---|---|---|---|
| 2025 | -- | $29,090 | $13,230 | $15,860 |
| 2024 | -- | $29,090 | $13,230 | $15,860 |
| 2023 | $1,553 | $50,470 | $9,590 | $40,880 |
| 2022 | $1,536 | $50,470 | $9,590 | $40,880 |
| 2021 | $1,541 | $50,470 | $9,590 | $40,880 |
| 2020 | $1,538 | $46,660 | $8,750 | $37,910 |
| 2019 | $1,509 | $46,660 | $8,750 | $37,910 |
| 2018 | $1,494 | $46,660 | $8,750 | $37,910 |
| 2017 | $1,742 | $40,500 | $9,210 | $31,290 |
| 2016 | $1,744 | $40,330 | $9,210 | $31,120 |
| 2015 | $1,760 | $40,330 | $9,210 | $31,120 |
| 2014 | $1,660 | $34,660 | $7,880 | $26,780 |
| 2013 | $834 | $34,660 | $7,880 | $26,780 |
Source: Public Records
Map
Nearby Homes
- 0 Neimans Ave SE Unit 5149957
- 2030 Woodland Park Ave SE
- 7205 Mapleton St SE
- 10400 Lincoln St SE
- 7547 Lincoln St SE
- 7145 Bluebird Rd NW
- 2079 Parks Ave SE
- 0 Lincoln St SE Unit 5157308
- 0 Lincoln St SE Unit 5157344
- 0 Lincoln St SE Unit 5157290
- 5666 Circlevale St SE
- 1990 Belfort Ave
- 229 Liberty St W
- 6805 Waynesburg Dr SE
- 223 Nassau St W
- 137 Noble St W
- 233 Nassau St W
- 225 - 227 Plum St N
- 12910 Lincoln St SE
- 7678 Waynesburg Dr SE
- 8921 Mapleton St SE
- 8965 Mapleton St SE
- 8913 Mapleton St SE
- 9015 Mapleton St SE
- 9015 Mapleton St SE
- 8869 Mapleton St SE
- 8870 Mapleton St SE
- 9029 Mapleton St SE
- 8831 Mapleton St SE
- 8830 Mapleton St SE
- 8810 Mapleton St SE
- 8771 Mapleton St SE
- 3415 Lotz Ave SE
- 8745 Mapleton St SE
- 8720 Mapleton St SE
- 3990 Lotz Ave SE
- 8613 Mapleton St SE
- 8636 Mapleton St SE
- 4038 Lotz Ave SE
- 3330 Lotz Ave SE