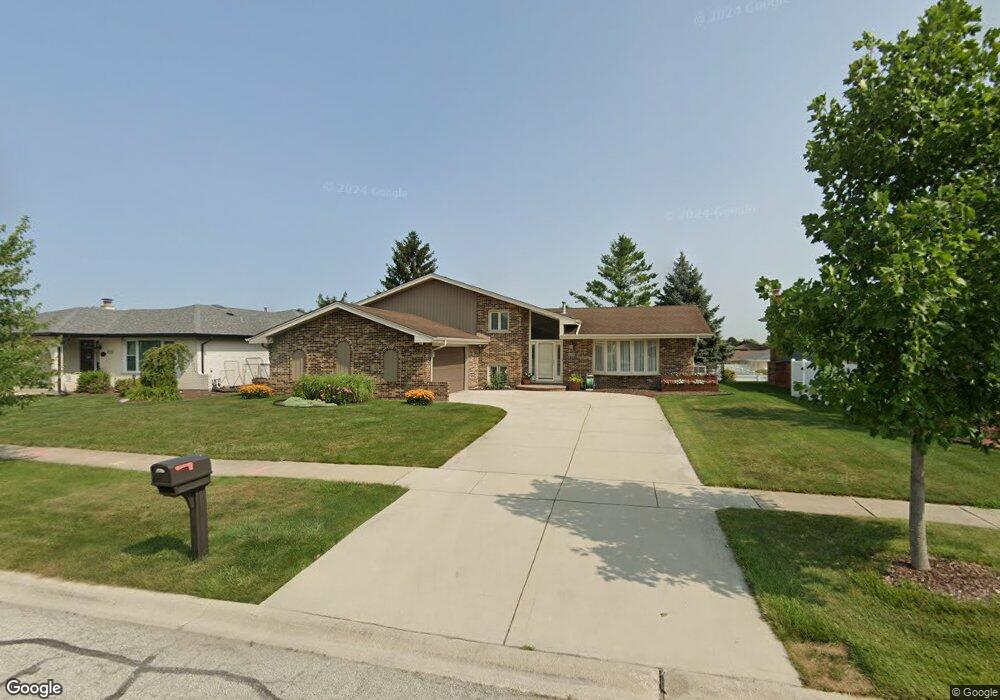
8942 Poplar St Tinley Park, IL 60487
Central Tinley Park NeighborhoodEstimated Value: $418,074 - $429,000
3
Beds
3
Baths
1,791
Sq Ft
$236/Sq Ft
Est. Value
About This Home
This home is located at 8942 Poplar St, Tinley Park, IL 60487 and is currently estimated at $423,519, approximately $236 per square foot. 8942 Poplar St is a home located in Cook County with nearby schools including Christa Mcauliffe School, Prairie View Middle School, and Victor J Andrew High School.
Ownership History
Date
Name
Owned For
Owner Type
Purchase Details
Closed on
Jun 28, 2005
Sold by
Rose Richard S and Rose Peggy D
Bought by
Konczyk P and Konczyk Amy M
Current Estimated Value
Home Financials for this Owner
Home Financials are based on the most recent Mortgage that was taken out on this home.
Original Mortgage
$238,400
Outstanding Balance
$125,170
Interest Rate
5.75%
Mortgage Type
Fannie Mae Freddie Mac
Estimated Equity
$298,349
Create a Home Valuation Report for This Property
The Home Valuation Report is an in-depth analysis detailing your home's value as well as a comparison with similar homes in the area
Home Values in the Area
Average Home Value in this Area
Purchase History
| Date | Buyer | Sale Price | Title Company |
|---|---|---|---|
| Konczyk P | $298,000 | Cti |
Source: Public Records
Mortgage History
| Date | Status | Borrower | Loan Amount |
|---|---|---|---|
| Open | Konczyk P | $238,400 |
Source: Public Records
Tax History Compared to Growth
Tax History
| Year | Tax Paid | Tax Assessment Tax Assessment Total Assessment is a certain percentage of the fair market value that is determined by local assessors to be the total taxable value of land and additions on the property. | Land | Improvement |
|---|---|---|---|---|
| 2024 | $9,075 | $36,000 | $5,400 | $30,600 |
| 2023 | $6,889 | $36,000 | $5,400 | $30,600 |
| 2022 | $6,889 | $22,742 | $4,725 | $18,017 |
| 2021 | $6,698 | $22,742 | $4,725 | $18,017 |
| 2020 | $6,600 | $22,742 | $4,725 | $18,017 |
| 2019 | $6,460 | $23,349 | $4,275 | $19,074 |
| 2018 | $6,320 | $23,349 | $4,275 | $19,074 |
| 2017 | $6,917 | $25,767 | $4,275 | $21,492 |
| 2016 | $6,431 | $21,860 | $3,825 | $18,035 |
| 2015 | $7,011 | $23,960 | $3,825 | $20,135 |
| 2014 | $6,968 | $23,960 | $3,825 | $20,135 |
| 2013 | $6,782 | $25,084 | $3,825 | $21,259 |
Source: Public Records
Map
Nearby Homes
- 17533 Pecan Ln
- 17631 Dover Ct
- 17964 Upland Dr
- 9280 Windsor Pkwy Unit 92
- Fremont Plan at Radcliffe Place
- Calysta Plan at Radcliffe Place
- Danbury Plan at Radcliffe Place
- Briarcliffe Plan at Radcliffe Place
- Eden Plan at Radcliffe Place
- Amberwood Plan at Radcliffe Place
- 9201 175th St
- 9260 Windsor Pkwy Unit 80
- 18055 Upland Dr
- 9038 Mansfield Dr Unit 8
- 9051 Mansfield Dr Unit 1
- 18248 Murphy Cir Unit 182
- 17324 Humber Ln
- 17230 Shetland Dr
- 17535 S La Grange Rd
- 17535-2 Lagrange Rd