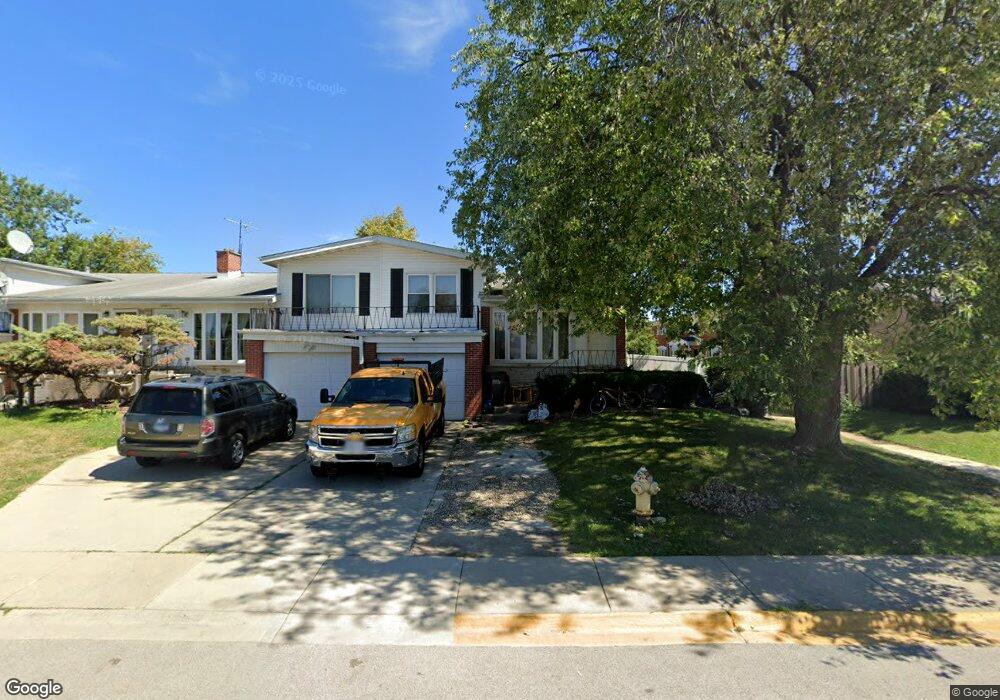
8943 Robin Dr Des Plaines, IL 60016
Estimated Value: $266,000 - $282,000
2
Beds
2
Baths
1,120
Sq Ft
$245/Sq Ft
Est. Value
About This Home
This home is located at 8943 Robin Dr, Des Plaines, IL 60016 and is currently estimated at $274,085, approximately $244 per square foot. 8943 Robin Dr is a home located in Cook County with nearby schools including Apollo Elementary School, Gemini Middle School, and Maine East High School.
Ownership History
Date
Name
Owned For
Owner Type
Purchase Details
Closed on
Feb 28, 2022
Sold by
Csiffari Adalbert and Csiffari Verona
Bought by
Syed Mukaram Ali and Syed Nazneen Rubina
Current Estimated Value
Home Financials for this Owner
Home Financials are based on the most recent Mortgage that was taken out on this home.
Original Mortgage
$189,000
Outstanding Balance
$175,486
Interest Rate
4%
Estimated Equity
$98,599
Purchase Details
Closed on
Jul 1, 2019
Sold by
Dubowski Andrzej and Dubowski Grazyna
Bought by
Csiffari Verona and Csiffari Adalbert
Home Financials for this Owner
Home Financials are based on the most recent Mortgage that was taken out on this home.
Original Mortgage
$196,377
Interest Rate
4.4%
Mortgage Type
FHA
Purchase Details
Closed on
May 9, 2009
Sold by
Dubowski Andrzej and Dubowski Grazyna
Bought by
Dubowski Daniel and Dubowski Andrzej
Create a Home Valuation Report for This Property
The Home Valuation Report is an in-depth analysis detailing your home's value as well as a comparison with similar homes in the area
Home Values in the Area
Average Home Value in this Area
Purchase History
| Date | Buyer | Sale Price | Title Company |
|---|---|---|---|
| Syed Mukaram Ali | $210,000 | -- | |
| Csiffari Verona | $200,000 | Altima Title Llc | |
| Dubowski Daniel | -- | None Available |
Source: Public Records
Mortgage History
| Date | Status | Borrower | Loan Amount |
|---|---|---|---|
| Open | Syed Mukaram Ali | $189,000 | |
| Previous Owner | Csiffari Verona | $196,377 |
Source: Public Records
Tax History
| Year | Tax Paid | Tax Assessment Tax Assessment Total Assessment is a certain percentage of the fair market value that is determined by local assessors to be the total taxable value of land and additions on the property. | Land | Improvement |
|---|---|---|---|---|
| 2025 | $5,691 | $22,000 | $2,876 | $19,124 |
| 2024 | $5,691 | $21,000 | $3,500 | $17,500 |
| 2023 | $4,531 | $21,000 | $3,500 | $17,500 |
| 2022 | $4,531 | $21,000 | $3,500 | $17,500 |
| 2021 | $4,274 | $16,941 | $1,598 | $15,343 |
| 2020 | $5,196 | $16,941 | $1,598 | $15,343 |
| 2019 | $4,154 | $18,824 | $1,598 | $17,226 |
| 2018 | $3,365 | $14,379 | $1,398 | $12,981 |
| 2017 | $3,337 | $14,379 | $1,398 | $12,981 |
| 2016 | $3,680 | $15,499 | $1,398 | $14,101 |
| 2015 | $3,198 | $12,969 | $1,198 | $11,771 |
| 2014 | $3,103 | $12,969 | $1,198 | $11,771 |
| 2013 | $3,034 | $12,969 | $1,198 | $11,771 |
Source: Public Records
Map
Nearby Homes
- 9241 W Ballard Rd Unit 107
- 8843 Robin Dr Unit C
- 8995 Kennedy Dr Unit 206F
- 8807 Dee Rd
- 1913 Rancho Ln
- 2000 Parkside Dr Unit FG
- 8810 Briar Ct Unit 1B
- 8802 Briar Ct Unit 3A
- 1710 Dempster St Unit A
- 9332 Landings Ln Unit 604
- 9332 Landings Ln Unit 404
- 9332 Landings Ln Unit 504
- 8970 N Parkside Ave Unit C408
- 8901 N Western Ave Unit A206
- 9396 Landings Ln Unit 306
- 9396 Landings Ln Unit 302
- 9396 Landings Ln Unit 202
- 9396 Landings Ln Unit 501
- 9396 Landings Ln Unit 201
- 9396 Landings Ln Unit 401
- 8943 Robin Dr Unit B
- 8943 Robin Dr
- 8943 Robin Dr
- 8943 Robin Dr
- 8943 Robin Dr
- 8943 Robin Dr
- 8943 Robin Dr Unit F
- 8939 Robin Dr
- 8939 Robin Dr
- 8939 Robin Dr
- 8939 Robin Dr
- 8939 Robin Dr
- 8939 Robin Dr
- 8939 Robin Dr Unit D
- 8939 Robin Dr Unit B
- 8939 Robin Dr Unit C
- 8953 Robin Dr
- 8953 Robin Dr
- 8953 Robin Dr
- 8953 Robin Dr
Your Personal Tour Guide
Ask me questions while you tour the home.