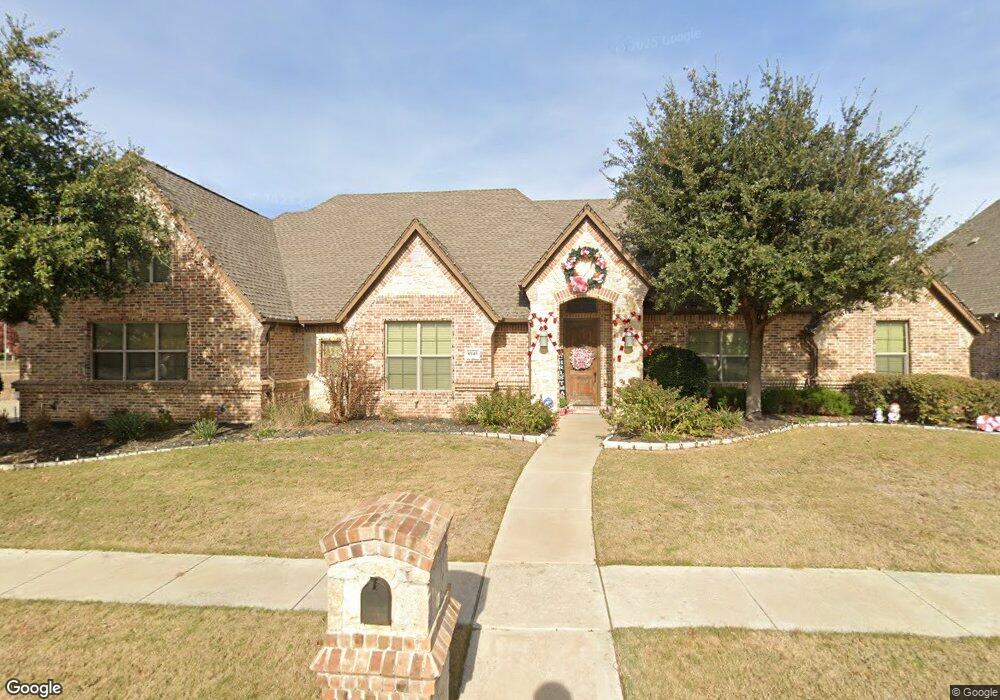
8945 Glendara Dr North Richland Hills, TX 76182
Estimated Value: $715,000 - $827,000
4
Beds
3
Baths
3,104
Sq Ft
$248/Sq Ft
Est. Value
About This Home
This home is located at 8945 Glendara Dr, North Richland Hills, TX 76182 and is currently estimated at $770,535, approximately $248 per square foot. 8945 Glendara Dr is a home located in Tarrant County with nearby schools including W.A. Porter Elementary School, Smithfield Middle School, and Birdville High School.
Ownership History
Date
Name
Owned For
Owner Type
Purchase Details
Closed on
May 9, 2011
Sold by
Independence Custom Homes Inc
Bought by
Hayen John R and Hayen Cherryl L
Current Estimated Value
Home Financials for this Owner
Home Financials are based on the most recent Mortgage that was taken out on this home.
Original Mortgage
$320,400
Outstanding Balance
$233,012
Interest Rate
6%
Mortgage Type
Construction
Estimated Equity
$537,523
Purchase Details
Closed on
May 6, 2011
Sold by
Panno Thomas
Bought by
Capstone Classic Homes Inc
Home Financials for this Owner
Home Financials are based on the most recent Mortgage that was taken out on this home.
Original Mortgage
$320,400
Outstanding Balance
$233,012
Interest Rate
6%
Mortgage Type
Construction
Estimated Equity
$537,523
Purchase Details
Closed on
Jan 13, 2010
Sold by
Capstone Classic Homes Lp
Bought by
Panno Thomas and First State Bank
Create a Home Valuation Report for This Property
The Home Valuation Report is an in-depth analysis detailing your home's value as well as a comparison with similar homes in the area
Home Values in the Area
Average Home Value in this Area
Purchase History
| Date | Buyer | Sale Price | Title Company |
|---|---|---|---|
| Hayen John R | -- | Stnt | |
| Independence Custom Homes | -- | Stewart | |
| Capstone Classic Homes Inc | -- | Stewart | |
| Panno Thomas | -- | Stnt | |
| Capstone Classic Homes Lp | -- | Stnt |
Source: Public Records
Mortgage History
| Date | Status | Borrower | Loan Amount |
|---|---|---|---|
| Open | Hayen John R | $320,400 |
Source: Public Records
Tax History Compared to Growth
Tax History
| Year | Tax Paid | Tax Assessment Tax Assessment Total Assessment is a certain percentage of the fair market value that is determined by local assessors to be the total taxable value of land and additions on the property. | Land | Improvement |
|---|---|---|---|---|
| 2025 | $11,920 | $708,093 | $137,785 | $570,308 |
| 2024 | $11,920 | $708,093 | $137,785 | $570,308 |
| 2023 | $13,100 | $720,779 | $137,785 | $582,994 |
| 2022 | $13,064 | $624,477 | $137,785 | $486,692 |
| 2021 | $12,559 | $493,542 | $100,000 | $393,542 |
| 2020 | $12,604 | $495,335 | $100,000 | $395,335 |
| 2019 | $13,091 | $497,127 | $100,000 | $397,127 |
| 2018 | $11,620 | $470,735 | $100,000 | $370,735 |
| 2017 | $11,514 | $471,326 | $100,000 | $371,326 |
| 2016 | $10,467 | $389,037 | $100,000 | $289,037 |
| 2015 | $9,033 | $356,400 | $60,000 | $296,400 |
| 2014 | $9,033 | $356,400 | $60,000 | $296,400 |
Source: Public Records
Map
Nearby Homes
- 7905 Hallmark Dr
- 8200 Thornhill Dr
- 7908 Hallmark Dr
- 8932 Thornberry Dr
- 8113 Biscayne Ct
- 9216 Cachelle Ct
- 9216 Hailey Ct
- 8205 Edgemont Ct
- TBD Kirk Ln
- 8312 Thornway Ct
- 8315 Thornridge Dr
- 616A Plan at Adkins Park - 70'
- 655A Plan at Adkins Park - 70'
- 634A Plan at Adkins Park - 70'
- 585A Plan at Adkins Park - 70'
- 620A Plan at Adkins Park - 70'
- 625A Plan at Adkins Park - 70'
- 650A Plan at Adkins Park - 70'
- 586A Plan at Adkins Park - 70'
- 617A Plan at Adkins Park - 70'
- 8949 Glendara Dr
- 8944 Glendara Dr
- 8940 Glendara Dr
- 8948 Glendara Dr
- 8953 Glendara Dr
- 8104 Thornwood Dr
- 8952 Glendara Dr
- 8941 Souththorn Dr
- 8101 Thornwood Dr
- 8957 Glendara Dr
- 8945 Souththorn Dr
- 8956 Belshire Dr
- 8956 Glendara Dr
- 8949 Souththorn Dr
- 8937 Souththorn Dr
- 8108 Thornwood Dr
- 8105 Thornwood Dr
- 8953 Souththorn Dr
- 9001 Glendara Dr
- 8100 Kentwood Dr