895 Baja St Laguna Beach, CA 92651
Estimated Value: $3,467,000 - $4,914,000
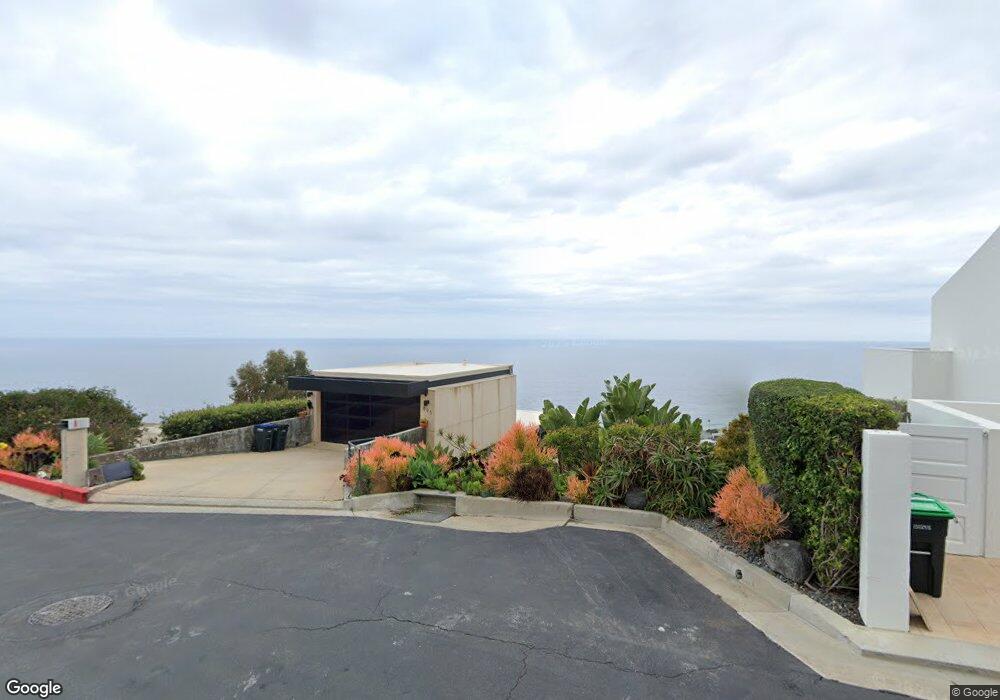
About This Home
This home is located at 895 Baja St, Laguna Beach, CA 92651 and is currently estimated at $4,093,012, approximately $1,280 per square foot. 895 Baja St is a home located in Orange County with nearby schools including Top Of The World Elementary School, Thurston Middle School, and Laguna Beach High School.
Ownership History
We collect this data history from publicly available records. To have your information removed, we recommend requesting removal directly through your county’s website.
Purchase Details
Home Financials for this Owner
Home Financials are based on the most recent Mortgage that was taken out on this home.Purchase Details
Purchase Details
Purchase Details
Home Financials for this Owner
Home Financials are based on the most recent Mortgage that was taken out on this home.Purchase Details
Home Financials for this Owner
Home Financials are based on the most recent Mortgage that was taken out on this home.Purchase Details
Home Financials for this Owner
Home Financials are based on the most recent Mortgage that was taken out on this home.Purchase Details
Home Financials for this Owner
Home Financials are based on the most recent Mortgage that was taken out on this home.Purchase Details
Home Financials for this Owner
Home Financials are based on the most recent Mortgage that was taken out on this home.Purchase Details
Home Financials for this Owner
Home Financials are based on the most recent Mortgage that was taken out on this home.Purchase Details
Home Financials for this Owner
Home Financials are based on the most recent Mortgage that was taken out on this home.Purchase Details
Home Financials for this Owner
Home Financials are based on the most recent Mortgage that was taken out on this home.Purchase Details
Purchase Details
Purchase Details
Home Financials for this Owner
Home Financials are based on the most recent Mortgage that was taken out on this home.Purchase Details
Home Financials for this Owner
Home Financials are based on the most recent Mortgage that was taken out on this home.Purchase History
We collect this data history from publicly available records. To have your information removed, we recommend requesting removal directly through your county’s website.
| Date | Buyer | Sale Price | Title Company |
|---|---|---|---|
| $1,454,000 | Servicelink | ||
| $1,454,310 | Accommodation | ||
| -- | Accommodation | ||
| -- | Accommodation | ||
| -- | Chicago Title Co | ||
| $2,450,000 | Chicago Title Co | ||
| -- | -- | ||
| $1,925,000 | Orange Coast Title | ||
| $1,325,000 | Chicago Title Co | ||
| -- | Chicago Title Co | ||
| $1,245,000 | Chicago Title Co | ||
| -- | Chicago Title Co | ||
| -- | -- | ||
| -- | Chicago Title Co | ||
| $722,500 | Chicago Title Co |
Mortgage History
We collect this data history from publicly available records. To have your information removed, we recommend requesting removal directly through your county’s website.
| Date | Status | Borrower | Loan Amount |
|---|---|---|---|
| Open | $872,400 | ||
| Previous Owner | $1,500,000 | ||
| Previous Owner | $1,500,000 | ||
| Previous Owner | $1,443,750 | ||
| Previous Owner | $927,500 | ||
| Previous Owner | $996,000 | ||
| Previous Owner | $578,000 | ||
| Closed | $96,200 |
Tax History
We collect this data history from publicly available records. To have your information removed, we recommend requesting removal directly through your county’s website.
| Year | Tax Paid | Tax Assessment Tax Assessment Total Assessment is a certain percentage of the fair market value that is determined by local assessors to be the total taxable value of land and additions on the property. | Land | Improvement |
|---|---|---|---|---|
| 2025 | $19,538 | $1,862,827 | $1,300,375 | $562,452 |
| 2024 | $19,538 | $1,826,301 | $1,274,877 | $551,424 |
| 2023 | $19,388 | $1,790,492 | $1,249,880 | $540,612 |
| 2022 | $18,963 | $1,755,385 | $1,225,373 | $530,012 |
| 2021 | $18,541 | $1,720,966 | $1,201,346 | $519,620 |
| 2020 | $18,284 | $1,703,320 | $1,189,028 | $514,292 |
| 2019 | $17,946 | $1,669,922 | $1,165,714 | $504,208 |
| 2018 | $17,583 | $1,637,179 | $1,142,857 | $494,322 |
| 2017 | $17,219 | $1,605,078 | $1,120,448 | $484,630 |
| 2016 | $16,877 | $1,573,606 | $1,098,478 | $475,128 |
| 2015 | $16,605 | $1,549,969 | $1,081,977 | $467,992 |
| 2014 | $16,277 | $1,519,608 | $1,060,783 | $458,825 |
Map
- 934 Bonnie Brae Ave
- 825 La Mirada St
- 2300 Crestview Dr
- 800 San Jose St
- 2590 Iris Way
- 1285 Cortez
- 2378 Crestview Dr
- 989 Miramar St
- 2333 San Clemente St
- 683 Alta Vista Way
- 840 Gainsborough Dr
- 1130 Del Mar Ave
- 2147 Crestview Dr
- 1095 Miramar St
- 1105 Miramar St
- 2100 Crestview Dr
- 1025 Oro St
- 1147 Miramar St
- 1080 Noria St
- 340 Moss St
Ask me questions while you tour the home.