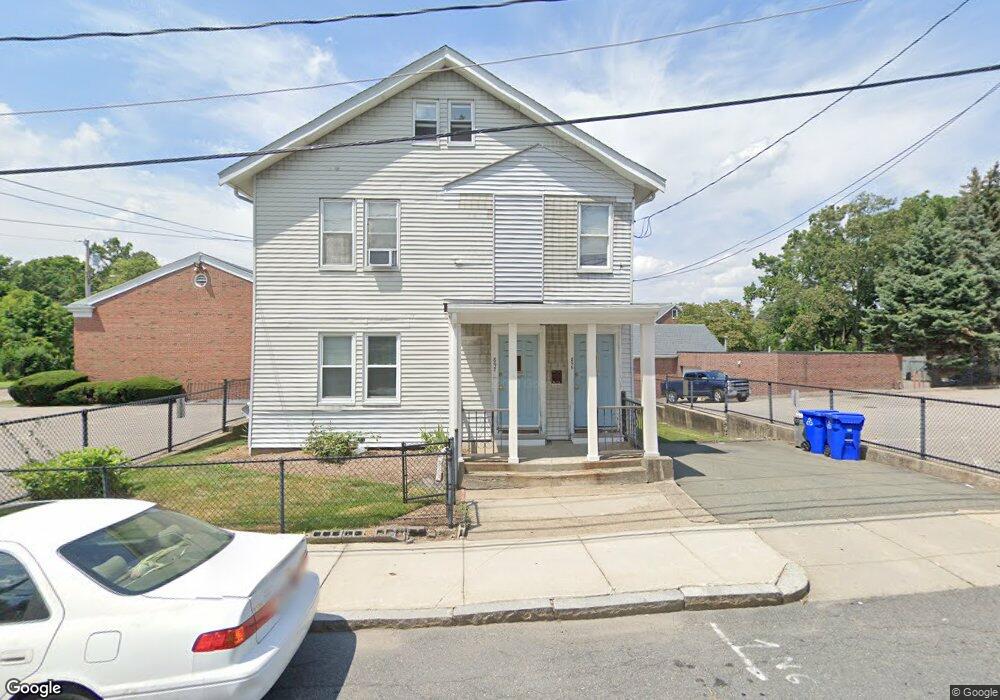
895 Canterbury St Roslindale, MA 02131
Roslindale NeighborhoodEstimated Value: $594,000 - $973,000
2
Beds
1
Bath
950
Sq Ft
$896/Sq Ft
Est. Value
About This Home
This home is located at 895 Canterbury St, Roslindale, MA 02131 and is currently estimated at $851,141, approximately $895 per square foot. 895 Canterbury St is a home located in Suffolk County with nearby schools including Brooke Charter School Roslindale, Sacred Heart STEM School, and St. Clare High School.
Ownership History
Date
Name
Owned For
Owner Type
Purchase Details
Closed on
Feb 2, 1998
Sold by
Chillemi Mary A and Casinelli Daria
Bought by
Russo Joseph A and Russo Pauline M
Current Estimated Value
Home Financials for this Owner
Home Financials are based on the most recent Mortgage that was taken out on this home.
Original Mortgage
$88,000
Outstanding Balance
$15,606
Interest Rate
7.02%
Mortgage Type
Purchase Money Mortgage
Estimated Equity
$835,535
Create a Home Valuation Report for This Property
The Home Valuation Report is an in-depth analysis detailing your home's value as well as a comparison with similar homes in the area
Home Values in the Area
Average Home Value in this Area
Purchase History
| Date | Buyer | Sale Price | Title Company |
|---|---|---|---|
| Russo Joseph A | $96,250 | -- | |
| Russo Joseph A | $13,750 | -- |
Source: Public Records
Mortgage History
| Date | Status | Borrower | Loan Amount |
|---|---|---|---|
| Open | Russo Joseph A | $88,000 |
Source: Public Records
Tax History Compared to Growth
Tax History
| Year | Tax Paid | Tax Assessment Tax Assessment Total Assessment is a certain percentage of the fair market value that is determined by local assessors to be the total taxable value of land and additions on the property. | Land | Improvement |
|---|---|---|---|---|
| 2025 | $7,171 | $619,300 | $175,900 | $443,400 |
| 2024 | $6,634 | $608,600 | $165,200 | $443,400 |
| 2023 | $6,226 | $579,700 | $157,300 | $422,400 |
| 2022 | $5,839 | $536,700 | $145,600 | $391,100 |
| 2021 | $5,402 | $506,300 | $137,400 | $368,900 |
| 2020 | $4,751 | $449,900 | $120,900 | $329,000 |
| 2019 | $4,555 | $432,200 | $95,700 | $336,500 |
| 2018 | $4,194 | $400,200 | $95,700 | $304,500 |
| 2017 | $3,960 | $373,900 | $95,700 | $278,200 |
| 2016 | $3,917 | $356,100 | $95,700 | $260,400 |
| 2015 | $3,496 | $288,700 | $94,200 | $194,500 |
| 2014 | $3,363 | $267,300 | $94,200 | $173,100 |
Source: Public Records
Map
Nearby Homes
- 8 Mount Calvary Rd Unit 4
- 543 Hyde Park Ave Unit 1
- 87 Clare Ave
- 25 Pinedale Rd Unit 1
- 27 Rowe St
- 32 Jewett St
- 16 Hilburn Place
- 103-105 Neponset Ave
- 103 Neponset Ave Unit 103A
- 577-579 American Legion Hwy
- 36 Neponset Ave Unit 1
- 105 Neponset Ave Unit 105
- 417 Poplar St
- 415 Poplar St
- 175 Clare Ave Unit B3
- 24 Waterman Rd
- 273 Metropolitan Ave Unit 2
- 579 American Legion Hwy
- 72 Livermore St
- 25 Crandall St
- 895 Canterbury St Unit 897
- 897 Canterbury St Unit canterbury st
- 897 Canterbury St
- 897 Canterbury St Unit 897
- 897 Canterbury St Unit 1
- 897 Canterbury St
- 898 Canterbury St
- 894 Canterbury St
- 907 Canterbury St
- 810 American Legion Hwy
- 810 American Legion Hwy
- 810 American Legion Hwy Unit 1
- 890 Canterbury St
- 806 American Legion Hwy
- 909 Canterbury St Unit 911
- 10 Gilman St
- 10 Gilman St
- 10 Gilman St Unit 1
- 10 Gilman St
- 39 Manning St