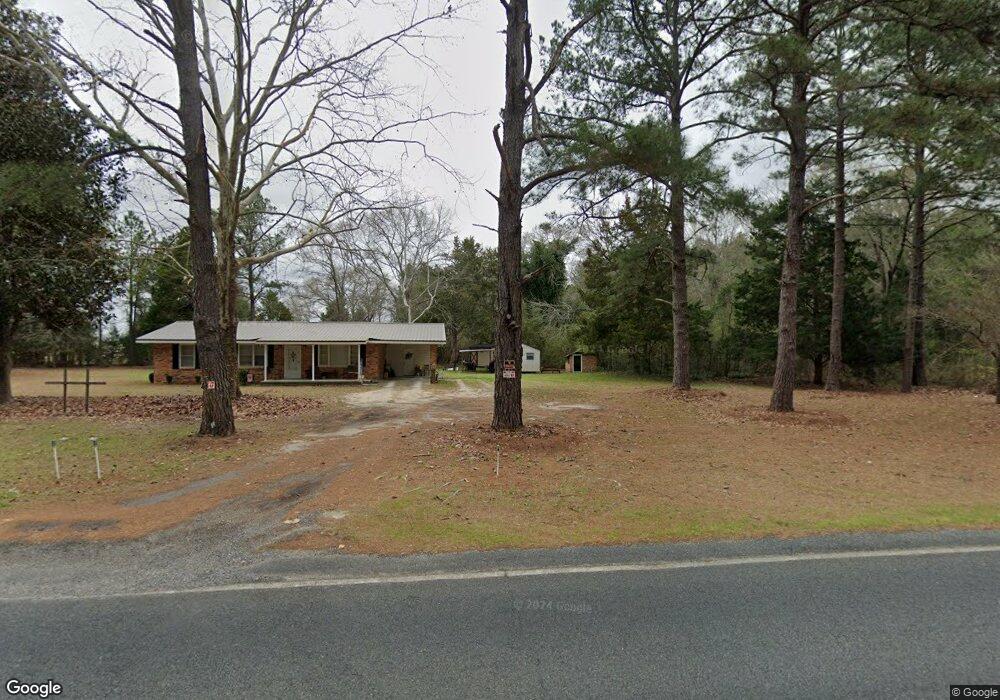
895 Ga Highway 126 Cochran, GA 31014
Estimated Value: $124,993 - $182,000
2
Beds
1
Bath
1,144
Sq Ft
$134/Sq Ft
Est. Value
About This Home
This home is located at 895 Ga Highway 126, Cochran, GA 31014 and is currently estimated at $153,748, approximately $134 per square foot. 895 Ga Highway 126 is a home located in Bleckley County with nearby schools including Bleckley County Primary School, Bleckley County Elementary School, and Bleckley Middle School.
Ownership History
Date
Name
Owned For
Owner Type
Purchase Details
Closed on
Feb 20, 2019
Sold by
Smith Brian Jacob Estate
Bought by
Norfleet Shawn W
Current Estimated Value
Home Financials for this Owner
Home Financials are based on the most recent Mortgage that was taken out on this home.
Original Mortgage
$74,900
Outstanding Balance
$65,716
Interest Rate
4.4%
Mortgage Type
New Conventional
Estimated Equity
$88,032
Purchase Details
Closed on
May 4, 2011
Sold by
Floyd J Quent
Bought by
Smith Brian J
Home Financials for this Owner
Home Financials are based on the most recent Mortgage that was taken out on this home.
Original Mortgage
$58,900
Interest Rate
4.85%
Mortgage Type
New Conventional
Purchase Details
Closed on
Nov 16, 2001
Sold by
Kight Edward O
Bought by
Floyd Floyd J and Floyd Quent
Purchase Details
Closed on
Jun 4, 1997
Sold by
Kight Edward O
Bought by
Kight Edward O
Purchase Details
Closed on
Jun 24, 1992
Bought by
Kight Edward O
Create a Home Valuation Report for This Property
The Home Valuation Report is an in-depth analysis detailing your home's value as well as a comparison with similar homes in the area
Home Values in the Area
Average Home Value in this Area
Purchase History
| Date | Buyer | Sale Price | Title Company |
|---|---|---|---|
| Norfleet Shawn W | $74,900 | -- | |
| Smith Brian J | $62,000 | -- | |
| Floyd Floyd J | $51,000 | -- | |
| Kight Edward O | -- | -- | |
| Kight Edward O | -- | -- |
Source: Public Records
Mortgage History
| Date | Status | Borrower | Loan Amount |
|---|---|---|---|
| Open | Norfleet Shawn W | $74,900 | |
| Previous Owner | Smith Brian J | $58,900 |
Source: Public Records
Tax History Compared to Growth
Tax History
| Year | Tax Paid | Tax Assessment Tax Assessment Total Assessment is a certain percentage of the fair market value that is determined by local assessors to be the total taxable value of land and additions on the property. | Land | Improvement |
|---|---|---|---|---|
| 2024 | $1,040 | $40,888 | $3,000 | $37,888 |
| 2023 | $1,079 | $40,888 | $3,000 | $37,888 |
| 2022 | $938 | $36,488 | $3,000 | $33,488 |
| 2021 | $754 | $27,888 | $2,400 | $25,488 |
| 2020 | $754 | $27,888 | $2,400 | $25,488 |
| 2019 | $690 | $23,652 | $4,800 | $18,852 |
| 2018 | $696 | $23,652 | $4,800 | $18,852 |
| 2017 | $695 | $23,652 | $4,800 | $18,852 |
| 2016 | $696 | $23,652 | $4,800 | $18,852 |
| 2015 | -- | $23,652 | $4,800 | $18,852 |
| 2014 | -- | $23,652 | $4,800 | $18,852 |
| 2013 | -- | $23,652 | $4,800 | $18,852 |
Source: Public Records
Map
Nearby Homes
- 205 Smith Sapp Rd
- 0 Jones Rd
- 319 Country Club Rd
- 178 Country Club Cir
- 0 Rock Hill Rd
- 166 Pebble Hills Rd
- 176 Pineland Estates Rd
- 288 Frank Cook Rd
- 238 Wood Oak Cir
- 0 Cheek Rd
- 156 Churchwell Rd
- Lots Crest Dr
- LAND Crest Dr
- 110 Chestnut Dr
- 191 Cheek Rd
- 10 Timber Way
- 7 Evergreen Dr
- 0 Wood Oak Cir Unit 233873
- 0 Wood Oak Cir Unit 9278951
- 264 Ann St
- 895 Georgia 126
- 903 Ga Highway 126
- 902 State Route 126
- 902 Georgia 126
- 902 Ga Highway 126
- 875 Ga Highway 126
- 864 Ga Highway 126
- 934 State Route 126
- 934 Ga Hwy 126 L-4
- 934 Ga Highway 126
- 934 Ga Highway 126
- 934 Ga Highway 126 Unit 6
- 934 Ga Highway 126
- 858 Ga Highway 126
- 171 Purser Braddy Rd
- 844 Ga Highway 126
- 118 Smith Sapp Rd
- 924 Ga Highway 126
- 128 Smith Sapp Rd
- 115 Smith Sapp Rd