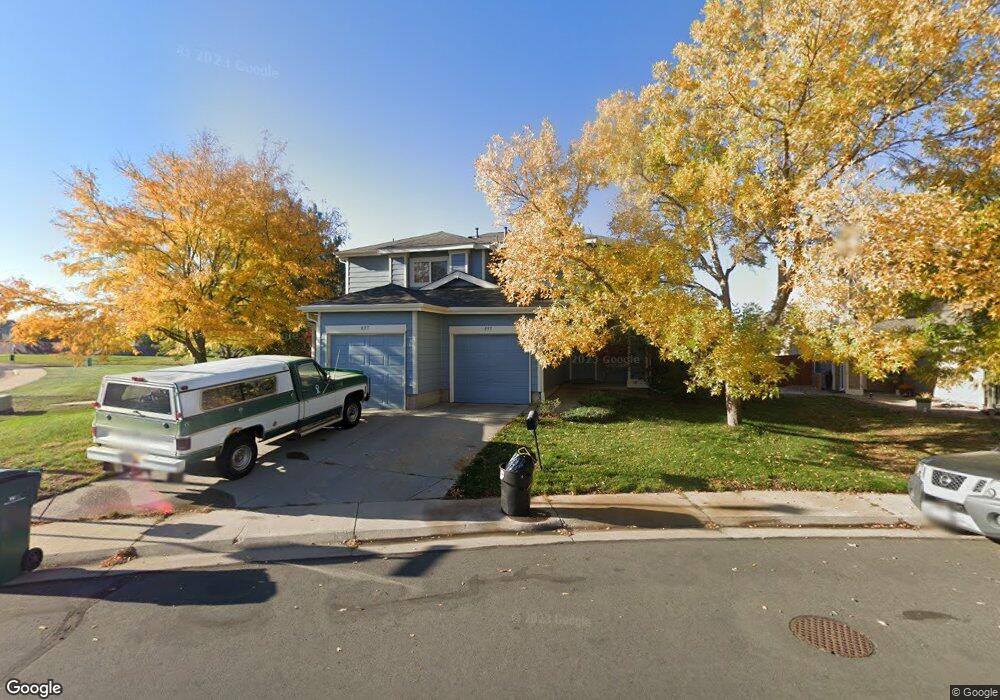
895 Mockingbird Ln Brighton, CO 80601
Estimated Value: $318,824 - $375,000
2
Beds
2
Baths
1,240
Sq Ft
$288/Sq Ft
Est. Value
About This Home
This home is located at 895 Mockingbird Ln, Brighton, CO 80601 and is currently estimated at $357,206, approximately $288 per square foot. 895 Mockingbird Ln is a home located in Adams County with nearby schools including South Elementary School, Rodger Quist Middle School, and Riverdale Ridge High School.
Ownership History
Date
Name
Owned For
Owner Type
Purchase Details
Closed on
Mar 8, 2023
Sold by
Cupps Ronald H
Bought by
Cupps Ronald H and Cupps Randy H
Current Estimated Value
Purchase Details
Closed on
Feb 9, 2023
Sold by
Cupps Ronald H
Bought by
Cupps Ronald H
Purchase Details
Closed on
Jul 22, 2022
Sold by
Cupps Randy H
Bought by
Cupps Randy H and Cupps Ronald H
Purchase Details
Closed on
Feb 5, 2022
Sold by
Cupps Ronald H
Bought by
Cupps Randy H and Cupps Michelle
Purchase Details
Closed on
Jun 25, 2001
Sold by
Landry Christine A
Bought by
Cupps Ronald H
Purchase Details
Closed on
Sep 21, 2000
Sold by
Kbone Inc
Bought by
Landry Christine A
Home Financials for this Owner
Home Financials are based on the most recent Mortgage that was taken out on this home.
Original Mortgage
$137,321
Interest Rate
7.96%
Mortgage Type
FHA
Create a Home Valuation Report for This Property
The Home Valuation Report is an in-depth analysis detailing your home's value as well as a comparison with similar homes in the area
Home Values in the Area
Average Home Value in this Area
Purchase History
| Date | Buyer | Sale Price | Title Company |
|---|---|---|---|
| Cupps Ronald H | -- | None Listed On Document | |
| Cupps Ronald H | -- | -- | |
| Cupps Randy H | -- | None Listed On Document | |
| Cupps Randy H | -- | None Listed On Document | |
| Cupps Ronald H | $154,000 | -- | |
| Landry Christine A | $138,554 | -- |
Source: Public Records
Mortgage History
| Date | Status | Borrower | Loan Amount |
|---|---|---|---|
| Previous Owner | Landry Christine A | $137,321 |
Source: Public Records
Tax History
| Year | Tax Paid | Tax Assessment Tax Assessment Total Assessment is a certain percentage of the fair market value that is determined by local assessors to be the total taxable value of land and additions on the property. | Land | Improvement |
|---|---|---|---|---|
| 2025 | $1,424 | $24,750 | $5,640 | $19,110 |
| 2024 | $1,424 | $22,750 | $5,190 | $17,560 |
| 2023 | $1,414 | $25,640 | $4,400 | $21,240 |
| 2022 | $1,305 | $18,550 | $3,680 | $14,870 |
| 2021 | $1,237 | $18,550 | $3,680 | $14,870 |
| 2020 | $1,060 | $17,540 | $3,790 | $13,750 |
| 2019 | $1,064 | $17,540 | $3,790 | $13,750 |
| 2018 | $777 | $14,730 | $1,220 | $13,510 |
| 2017 | $767 | $14,730 | $1,220 | $13,510 |
| 2016 | $596 | $11,610 | $1,350 | $10,260 |
| 2015 | $590 | $5,810 | $680 | $5,130 |
| 2014 | $352 | $3,500 | $680 | $2,820 |
Source: Public Records
Map
Nearby Homes
- 892 Mockingbird Ln
- 846 Mockingbird Ln
- 727 Mockingbird St
- 677 Mockingbird St
- 1104 Sandpiper Ln
- 1305 Waxwing Ave
- 1370 Bluebird St
- 395 Cedar Ave
- 362 Dogwood Ave
- 393 Ash Ave
- 141 E Bromley Ln
- 239 Miller Ave
- 475 S 2nd Ave
- 475 S 2nd Ave Unit Plot 1
- 230 Ash Ave Unit 4
- 544 S 3rd Ave
- 303 S 2nd Ave
- 617 S 5th Ave
- 660 S 5th Ave
- 219 S 3rd Ave
- 893 Mockingbird Ln
- 897 Mockingbird Ln
- 897 Mockingbird Ln
- 891 Mockingbird Ln
- 887 Mockingbird Ln
- 885 Mockingbird Ln
- 890 Mockingbird Ln
- 883 Mockingbird Ln
- 882 Mockingbird Ln
- 881 Mockingbird Ln
- 900 Canary Ct
- 880 Mockingbird Ln
- 877 Mockingbird Ln
- 902 Canary Ct
- 899 Canary Ln
- 874 Mockingbird Ln
- 875 Mockingbird Ln
- 897 Canary Ln
- 920 Canary Ct
- 873 Mockingbird St
Your Personal Tour Guide
Ask me questions while you tour the home.