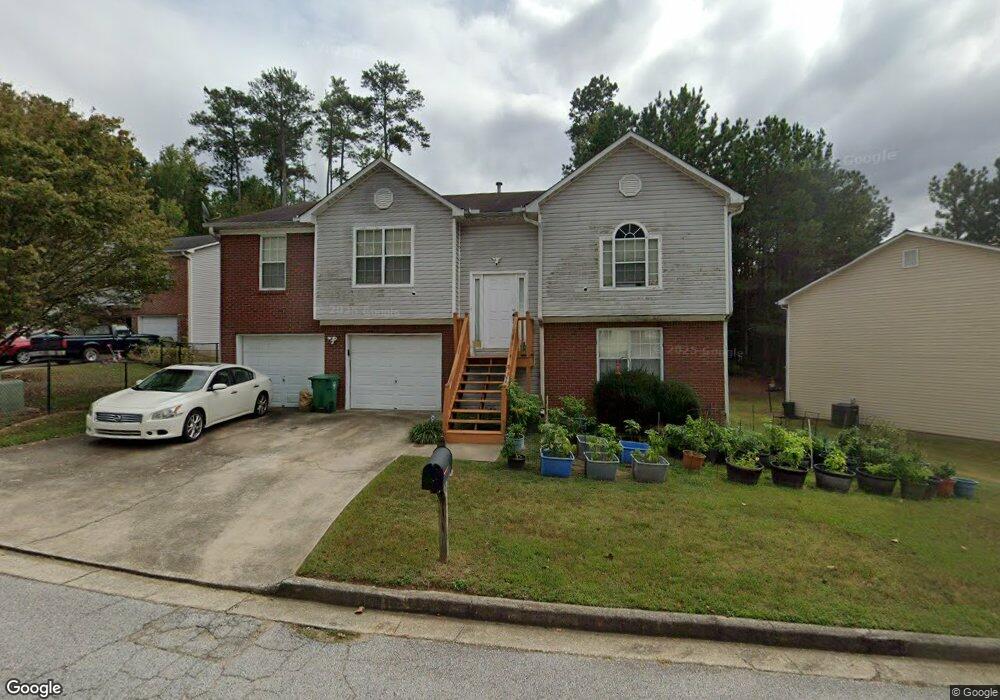
895 Stonebridge Crescent Lithonia, GA 30058
Estimated Value: $280,000 - $318,000
4
Beds
3
Baths
2,492
Sq Ft
$120/Sq Ft
Est. Value
About This Home
This home is located at 895 Stonebridge Crescent, Lithonia, GA 30058 and is currently estimated at $299,663, approximately $120 per square foot. 895 Stonebridge Crescent is a home located in DeKalb County with nearby schools including Rock Chapel Elementary School, Stephenson Middle School, and Stephenson High School.
Ownership History
Date
Name
Owned For
Owner Type
Purchase Details
Closed on
Jul 27, 2021
Sold by
Reynolds Jimmy Dean
Bought by
Reynolds Jimmy Dean and Reynolds Becky
Current Estimated Value
Purchase Details
Closed on
Dec 8, 2020
Sold by
Reynolds Anthony Tawaynne
Bought by
Reynolds Jimmy Dean
Purchase Details
Closed on
Jul 13, 1999
Sold by
Poe Lyle S
Bought by
Poe I Kathleen
Purchase Details
Closed on
Oct 22, 1998
Sold by
Edgar Inc
Bought by
Reynold Anthony T
Home Financials for this Owner
Home Financials are based on the most recent Mortgage that was taken out on this home.
Original Mortgage
$101,520
Interest Rate
6.76%
Mortgage Type
New Conventional
Purchase Details
Closed on
May 26, 1998
Sold by
Mountain Creek Partnership Lp
Bought by
Edgar Inc
Home Financials for this Owner
Home Financials are based on the most recent Mortgage that was taken out on this home.
Original Mortgage
$93,000
Interest Rate
7.11%
Mortgage Type
New Conventional
Create a Home Valuation Report for This Property
The Home Valuation Report is an in-depth analysis detailing your home's value as well as a comparison with similar homes in the area
Home Values in the Area
Average Home Value in this Area
Purchase History
| Date | Buyer | Sale Price | Title Company |
|---|---|---|---|
| Reynolds Jimmy Dean | -- | -- | |
| Reynolds Jimmy Dean | -- | -- | |
| Poe I Kathleen | -- | -- | |
| Reynold Anthony T | $126,900 | -- | |
| Edgar Inc | $13,500 | -- |
Source: Public Records
Mortgage History
| Date | Status | Borrower | Loan Amount |
|---|---|---|---|
| Previous Owner | Reynold Anthony T | $101,520 | |
| Previous Owner | Edgar Inc | $93,000 |
Source: Public Records
Tax History Compared to Growth
Tax History
| Year | Tax Paid | Tax Assessment Tax Assessment Total Assessment is a certain percentage of the fair market value that is determined by local assessors to be the total taxable value of land and additions on the property. | Land | Improvement |
|---|---|---|---|---|
| 2025 | $3,015 | $109,800 | $7,400 | $102,400 |
| 2024 | $3,156 | $113,440 | $7,400 | $106,040 |
| 2023 | $3,156 | $108,920 | $7,400 | $101,520 |
| 2022 | $2,869 | $104,080 | $7,400 | $96,680 |
| 2021 | $2,330 | $80,720 | $7,400 | $73,320 |
| 2020 | $2,105 | $70,760 | $7,400 | $63,360 |
| 2019 | $1,882 | $61,720 | $7,400 | $54,320 |
| 2018 | $1,666 | $59,800 | $7,400 | $52,400 |
| 2017 | $1,620 | $48,280 | $7,400 | $40,880 |
| 2016 | $1,611 | $49,440 | $7,400 | $42,040 |
| 2014 | $931 | $28,280 | $7,400 | $20,880 |
Source: Public Records
Map
Nearby Homes
- 731 Bridgewood Ct
- 672 Stonebridge Loop
- 728 Stonebridge Crescent
- 731 Stonebridge Park Cir
- 7249 Misty Harbor Ct
- 734 Stonebridge Park Cir
- 751 Stonebridge Park Cir
- 7536 Stonebridge Bay Ct
- 757 Stonebridge Park Cir
- 829 Carlingford Place
- 596 Watson Cove
- 854 Asbury Trail
- 857 Asbury Trail
- 775 Edenberry Ln Unit 1
- 872 Asbury Trail
- 660 Kilkenny Cir
- 791 Bristol Way Unit 1
- 776 Edenberry Ln
- 7593 Watson Bay Ct
- 7592 Watson Kaye
- 889 Stonebridge Crescent
- 899 Stonebridge Crescent
- 879 Stonebridge Crescent
- 735 Bridgewood Ct
- 903 Stonebridge Crescent
- 903 Stonebridge Crescent Unit 21
- 894 Stonebridge Crescent
- 875 Stonebridge Crescent
- 727 Bridgewood Ct
- 898 Stonebridge Crescent
- 906 Stonebridge Crescent
- 902 Stonebridge Crescent Unit 23
- 882 Stonebridge Crescent
- 878 Stonebridge Crescent
- 665 Stonebridge Loop
- 661 Stonebridge Loop
- 723 Bridgewood Ct
- 669 Stonebridge Loop
- 874 Stonebridge Crescent
- 724 Bridgewood Ct