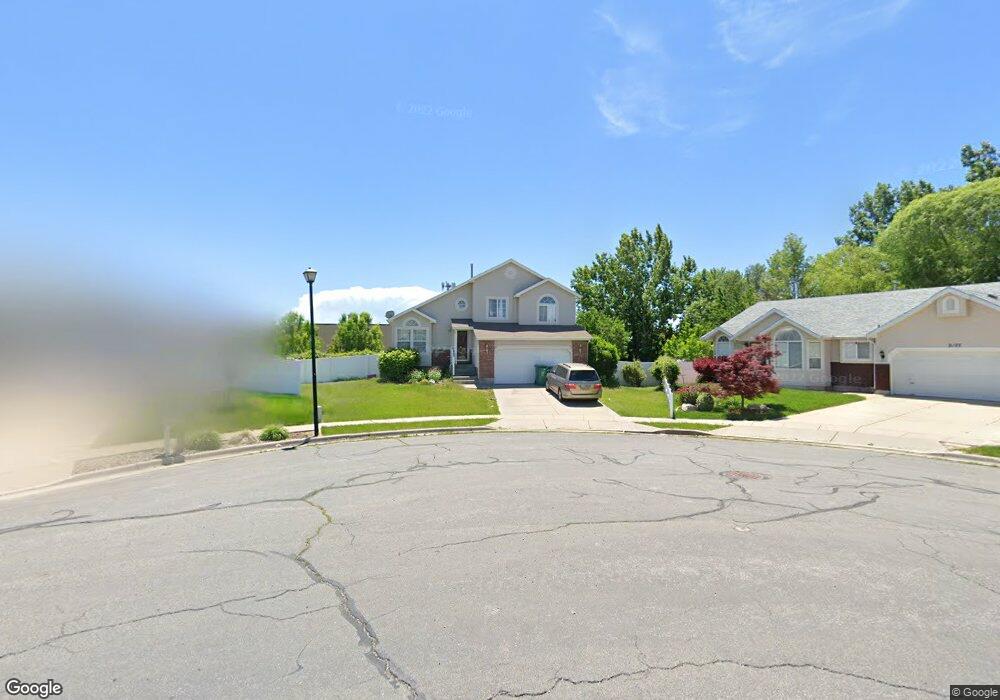
895 W 2175 N Layton, UT 84041
Estimated Value: $480,000 - $525,000
4
Beds
3
Baths
1,937
Sq Ft
$260/Sq Ft
Est. Value
About This Home
This home is located at 895 W 2175 N, Layton, UT 84041 and is currently estimated at $502,847, approximately $259 per square foot. 895 W 2175 N is a home located in Davis County with nearby schools including Lincoln Elementary School, North Layton Junior High School, and Northridge High School.
Ownership History
Date
Name
Owned For
Owner Type
Purchase Details
Closed on
Mar 9, 2011
Sold by
C & A Properties
Bought by
Rohwer Robert and Rohwer Summer
Current Estimated Value
Home Financials for this Owner
Home Financials are based on the most recent Mortgage that was taken out on this home.
Original Mortgage
$6,596
Outstanding Balance
$4,548
Interest Rate
5.02%
Mortgage Type
Stand Alone Second
Estimated Equity
$498,299
Purchase Details
Closed on
Nov 17, 2010
Sold by
Williams Robin R
Bought by
C & A Properties
Purchase Details
Closed on
Mar 30, 1999
Sold by
Gmw Development Inc
Bought by
Williams Robin R
Home Financials for this Owner
Home Financials are based on the most recent Mortgage that was taken out on this home.
Original Mortgage
$149,591
Interest Rate
6.79%
Mortgage Type
FHA
Create a Home Valuation Report for This Property
The Home Valuation Report is an in-depth analysis detailing your home's value as well as a comparison with similar homes in the area
Home Values in the Area
Average Home Value in this Area
Purchase History
| Date | Buyer | Sale Price | Title Company |
|---|---|---|---|
| Rohwer Robert | -- | Metro National Title | |
| C & A Properties | -- | Accommodation | |
| Williams Robin R | -- | Bonneville Title Company Inc |
Source: Public Records
Mortgage History
| Date | Status | Borrower | Loan Amount |
|---|---|---|---|
| Open | Rohwer Robert | $6,596 | |
| Open | Rohwer Robert | $176,411 | |
| Previous Owner | Williams Robin R | $149,591 |
Source: Public Records
Tax History Compared to Growth
Tax History
| Year | Tax Paid | Tax Assessment Tax Assessment Total Assessment is a certain percentage of the fair market value that is determined by local assessors to be the total taxable value of land and additions on the property. | Land | Improvement |
|---|---|---|---|---|
| 2025 | $2,232 | $234,300 | $107,144 | $127,156 |
| 2024 | $2,133 | $225,500 | $124,529 | $100,971 |
| 2023 | $2,119 | $395,000 | $145,155 | $249,845 |
| 2022 | $2,201 | $222,750 | $77,605 | $145,145 |
| 2021 | $2,067 | $312,000 | $111,167 | $200,833 |
| 2020 | $1,878 | $272,000 | $92,563 | $179,437 |
| 2019 | $1,826 | $259,000 | $87,033 | $171,967 |
| 2018 | $1,643 | $234,000 | $87,033 | $146,967 |
| 2016 | $1,543 | $113,355 | $28,436 | $84,919 |
| 2015 | $1,555 | $108,460 | $28,436 | $80,024 |
| 2014 | $1,614 | $115,068 | $28,436 | $86,632 |
| 2013 | -- | $100,512 | $26,884 | $73,628 |
Source: Public Records
Map
Nearby Homes
- 2149 N 750 W
- 2298 N 1085 W
- 1155 W 2200 N
- 2211 N 525 W
- 506 W 2200 N
- 2248 N 500 W
- 2233 N 475 W
- 538 W 1875 N
- 1094 N Angel St W
- 1036 N Angel St W
- 1615 N Angel St W
- 398 Paul Ave
- 1425 W 1650 N
- 1615 N Angel St Unit F
- 1615 N Angel St Unit I
- 1615 N Angel St Unit E
- 1615 N Angel St Unit B
- 1615 N Angel St
- 1615 N Angel St Unit C
- 1615 N Angel St Unit H