Estimated Value: $473,777 - $545,000
--
Bed
--
Bath
1,838
Sq Ft
$279/Sq Ft
Est. Value
About This Home
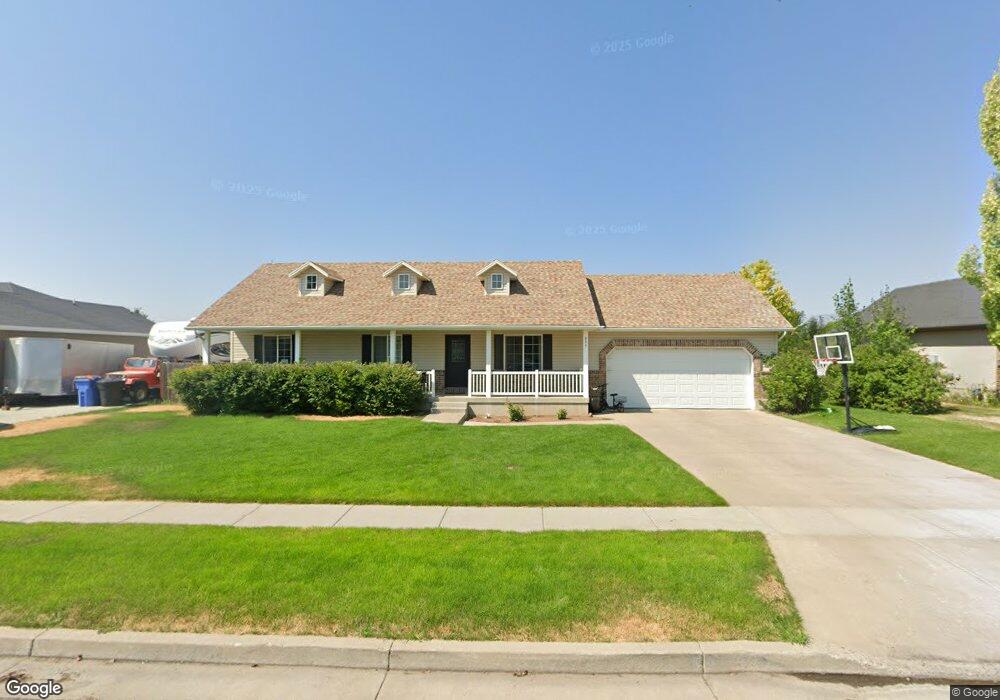
This home is located at 895 W 2840 S, Logan, UT 84321 and is currently estimated at $512,944, approximately $279 per square foot. 895 W 2840 S is a home with nearby schools including Nibley School, Spring Creek Middle School, and South Cache Middle School.
Ownership History
Date
Name
Owned For
Owner Type
Purchase Details
Closed on
Jan 21, 2009
Sold by
Madrid Fernando and Madrid Giselle M
Bought by
Madrid Fernando and Madrid Giselle Maria
Current Estimated Value
Home Financials for this Owner
Home Financials are based on the most recent Mortgage that was taken out on this home.
Original Mortgage
$184,592
Outstanding Balance
$115,920
Interest Rate
5.14%
Mortgage Type
FHA
Estimated Equity
$397,024
Purchase Details
Closed on
Feb 15, 2006
Sold by
Trunnell Brigham
Bought by
Madrid Fernando and Madrid Giselle M
Home Financials for this Owner
Home Financials are based on the most recent Mortgage that was taken out on this home.
Original Mortgage
$186,860
Interest Rate
6.04%
Mortgage Type
FHA
Purchase Details
Closed on
Mar 21, 2005
Sold by
Nibley Gardens Inc
Bought by
Trunnell Brigham
Create a Home Valuation Report for This Property
The Home Valuation Report is an in-depth analysis detailing your home's value as well as a comparison with similar homes in the area
Home Values in the Area
Average Home Value in this Area
Purchase History
| Date | Buyer | Sale Price | Title Company |
|---|---|---|---|
| Madrid Fernando | -- | Northern Title Company | |
| Madrid Fernando | -- | Northern Title Company | |
| Trunnell Brigham | -- | Cache Title Company |
Source: Public Records
Mortgage History
| Date | Status | Borrower | Loan Amount |
|---|---|---|---|
| Open | Madrid Fernando | $184,592 | |
| Closed | Madrid Fernando | $186,860 |
Source: Public Records
Tax History Compared to Growth
Tax History
| Year | Tax Paid | Tax Assessment Tax Assessment Total Assessment is a certain percentage of the fair market value that is determined by local assessors to be the total taxable value of land and additions on the property. | Land | Improvement |
|---|---|---|---|---|
| 2025 | $2,028 | $268,760 | $0 | $0 |
| 2024 | $2,165 | $269,440 | $0 | $0 |
| 2023 | $2,269 | $264,365 | $0 | $0 |
| 2022 | $2,361 | $264,370 | $0 | $0 |
| 2021 | $2,286 | $397,535 | $65,000 | $332,535 |
| 2020 | $2,056 | $340,300 | $65,000 | $275,300 |
| 2019 | $2,156 | $340,300 | $65,000 | $275,300 |
| 2018 | $1,869 | $287,830 | $40,000 | $247,830 |
| 2017 | $1,789 | $145,915 | $0 | $0 |
| 2016 | $1,809 | $133,265 | $0 | $0 |
| 2015 | $1,514 | $122,945 | $0 | $0 |
| 2014 | $1,480 | $122,945 | $0 | $0 |
| 2013 | -- | $125,695 | $0 | $0 |
Source: Public Records
Map
Nearby Homes