Estimated Value: $383,000 - $488,000
4
Beds
2
Baths
868
Sq Ft
$498/Sq Ft
Est. Value
About This Home
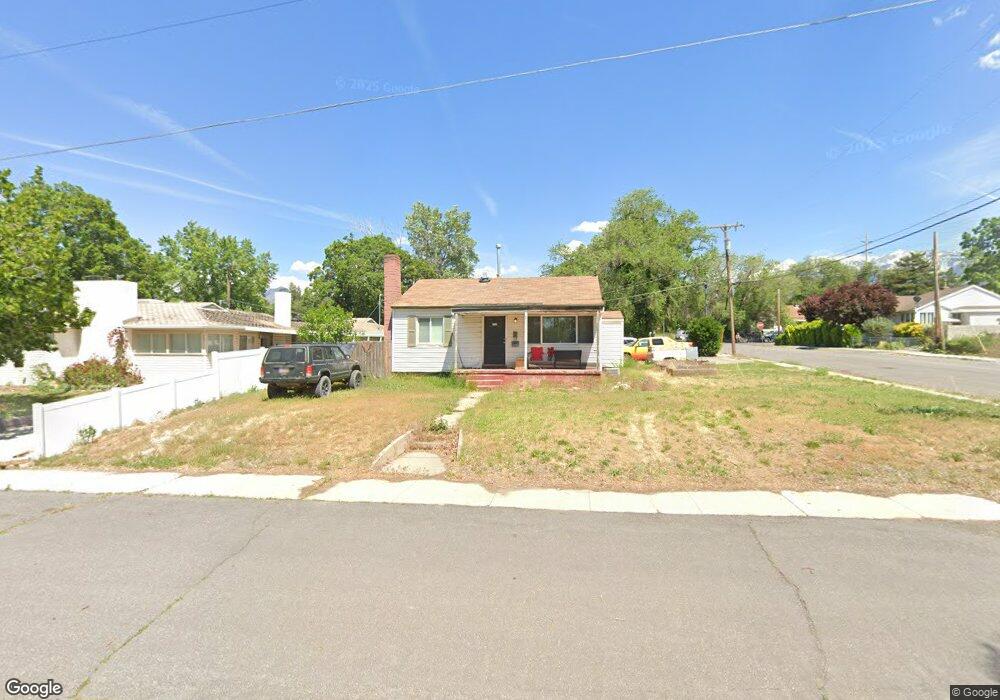
This home is located at 8951 S 40 E, Sandy, UT 84070 and is currently estimated at $431,944, approximately $497 per square foot. 8951 S 40 E is a home located in Salt Lake County with nearby schools including Sandy Elementary School, Mount Jordan Middle School, and Jordan High.
Ownership History
Date
Name
Owned For
Owner Type
Purchase Details
Closed on
Aug 7, 2007
Sold by
Cowdell Troy L
Bought by
Hanson Kevin R
Current Estimated Value
Home Financials for this Owner
Home Financials are based on the most recent Mortgage that was taken out on this home.
Original Mortgage
$150,000
Outstanding Balance
$94,924
Interest Rate
6.65%
Mortgage Type
Purchase Money Mortgage
Estimated Equity
$337,020
Purchase Details
Closed on
Aug 26, 2002
Sold by
Cowdell Troy L and Cowdell Scott L
Bought by
Cowdell Troy L
Purchase Details
Closed on
Jul 2, 2001
Sold by
Coats Randall V and Peart Michele
Bought by
Cowdell Troy L and Cowdell Scott L
Home Financials for this Owner
Home Financials are based on the most recent Mortgage that was taken out on this home.
Original Mortgage
$103,574
Interest Rate
7.24%
Mortgage Type
FHA
Create a Home Valuation Report for This Property
The Home Valuation Report is an in-depth analysis detailing your home's value as well as a comparison with similar homes in the area
Home Values in the Area
Average Home Value in this Area
Purchase History
| Date | Buyer | Sale Price | Title Company |
|---|---|---|---|
| Hanson Kevin R | -- | Atlas Title Murray | |
| Cowdell Troy L | -- | Meridian Title | |
| Cowdell Troy L | -- | Meridian Title |
Source: Public Records
Mortgage History
| Date | Status | Borrower | Loan Amount |
|---|---|---|---|
| Open | Hanson Kevin R | $150,000 | |
| Previous Owner | Cowdell Troy L | $103,574 |
Source: Public Records
Tax History
| Year | Tax Paid | Tax Assessment Tax Assessment Total Assessment is a certain percentage of the fair market value that is determined by local assessors to be the total taxable value of land and additions on the property. | Land | Improvement |
|---|---|---|---|---|
| 2025 | $1,752 | $393,100 | $118,100 | $275,000 |
| 2024 | $1,752 | $324,100 | $108,300 | $215,800 |
| 2023 | $1,623 | $299,200 | $103,000 | $196,200 |
| 2022 | $1,723 | $310,400 | $101,000 | $209,400 |
| 2021 | $1,645 | $252,200 | $79,000 | $173,200 |
| 2020 | $1,580 | $228,400 | $79,000 | $149,400 |
| 2019 | $1,477 | $208,100 | $79,000 | $129,100 |
| 2016 | $1,165 | $157,900 | $56,900 | $101,000 |
Source: Public Records
Map
Nearby Homes
- 136 W Freedom Ave Unit 136
- 8558 S Center St
- 112 E 8680 S
- 87 W 8710 S
- 181 E 9180 S
- 37 Crawford Place
- 8812 S Stratford Cir
- 140 W 8710 S
- 140 Paula Dr
- 270 E 8680 S
- 362 E 9150 S
- 87 Pioneer Ave
- 220 E Pioneer Ave
- 149 E Pioneer Ave
- 194 Pioneer Ave
- 412 E 8760 S
- 8470 Solar Way
- 227 E St Germain Way
- 9420 S Streatham Rd
- 8459 S 300 E
Your Personal Tour Guide
Ask me questions while you tour the home.