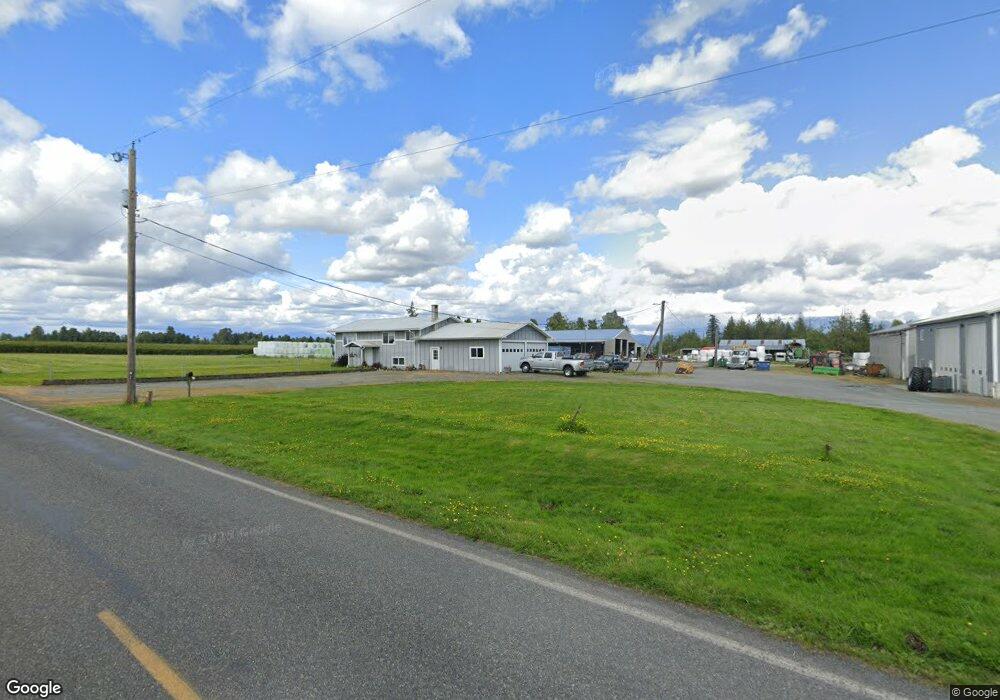
8952 Trapline Rd Everson, WA 98247
Estimated Value: $1,134,000
3
Beds
2
Baths
1,144
Sq Ft
$991/Sq Ft
Est. Value
About This Home
This home is located at 8952 Trapline Rd, Everson, WA 98247 and is currently estimated at $1,134,000, approximately $991 per square foot. 8952 Trapline Rd is a home located in Whatcom County with nearby schools including Nooksack Elementary School, Sumas Elementary School, and Everson Elementary School.
Ownership History
Date
Name
Owned For
Owner Type
Purchase Details
Closed on
Mar 30, 2005
Sold by
Vandyken Dean Allen
Bought by
Vandyken Dean Allen and Vandyken Lisa Lee
Current Estimated Value
Purchase Details
Closed on
Aug 5, 2002
Sold by
Vandyken Dean and Vandyken Lisa
Bought by
Vandyken Dean
Home Financials for this Owner
Home Financials are based on the most recent Mortgage that was taken out on this home.
Original Mortgage
$201,500
Outstanding Balance
$82,626
Interest Rate
6.52%
Estimated Equity
$999,374
Create a Home Valuation Report for This Property
The Home Valuation Report is an in-depth analysis detailing your home's value as well as a comparison with similar homes in the area
Purchase History
| Date | Buyer | Sale Price | Title Company |
|---|---|---|---|
| Vandyken Dean Allen | -- | First American Title Insuran | |
| Vandyken Dean | -- | Chicago Title Insurance | |
| Vandyken Dean | $124,356 | Chicago Title Insurance |
Source: Public Records
Mortgage History
| Date | Status | Borrower | Loan Amount |
|---|---|---|---|
| Open | Vandyken Dean | $201,500 |
Source: Public Records
Tax History
| Year | Tax Paid | Tax Assessment Tax Assessment Total Assessment is a certain percentage of the fair market value that is determined by local assessors to be the total taxable value of land and additions on the property. | Land | Improvement |
|---|---|---|---|---|
| 2025 | $7,671 | $1,060,618 | $447,007 | $613,611 |
| 2024 | $6,775 | $1,041,227 | $442,582 | $598,645 |
| 2023 | $6,775 | $1,055,064 | $369,512 | $685,552 |
| 2022 | $5,616 | $950,523 | $332,899 | $617,624 |
| 2021 | $5,630 | $742,581 | $260,072 | $482,509 |
| 2020 | $4,913 | $441,386 | $32,480 | $408,906 |
| 2019 | $4,163 | $568,057 | $198,949 | $369,108 |
| 2018 | $5,058 | $380,505 | $28,000 | $352,505 |
| 2017 | $4,361 | $347,075 | $28,608 | $318,467 |
| 2016 | $4,347 | $309,222 | $25,488 | $283,734 |
| 2015 | $3,664 | $309,222 | $25,488 | $283,734 |
| 2014 | -- | $300,281 | $32,844 | $267,437 |
| 2013 | -- | $294,947 | $31,785 | $263,162 |
Source: Public Records
Map
Nearby Homes
- 1915 Hampton Rd
- 1925 Hampton Rd
- 2173 Lagerwey Cir
- 1766 Hampton Rd
- 2178 Lagerwey Cir
- 2105 Lagerwey Cir
- 2103 Lagerwey Cir
- 2014 Monteview Ct
- 303 Hayes St
- 1979 Woodsman Dr
- 1950 N Prairie Ln
- 2068 Bowfin Way
- 1949 Junegrass Dr
- 2027 Steelhead Way
- 702 N Washington St
- 2075 Bluestem St
- 1963 Bluestem St
- 1340 Kamm Rd
- 409 W 4th St
- 412 W 3rd St
- 8916 Trapline Rd
- 2482 E Badger Rd
- 2584 E Badger Rd
- 2422 E Badger Rd
- 2634 E Badger Rd
- 2419 E Badger Rd
- 3257 E Badger Rd
- 8831 Trapline Rd
- 2165 E Badger Rd
- 2125 E Badger Rd
- 2199 E Badger Rd
- 2668 E Badger Rd
- 2640 E Badger Rd
- 2669 E Badger Rd
- 0 E 0e Badger Rd
- 0 1xx E Badger Rd
- 27 E Badger Rd
- 1573 E Badger Rd
- 0 E Badger Rd
Your Personal Tour Guide
Ask me questions while you tour the home.