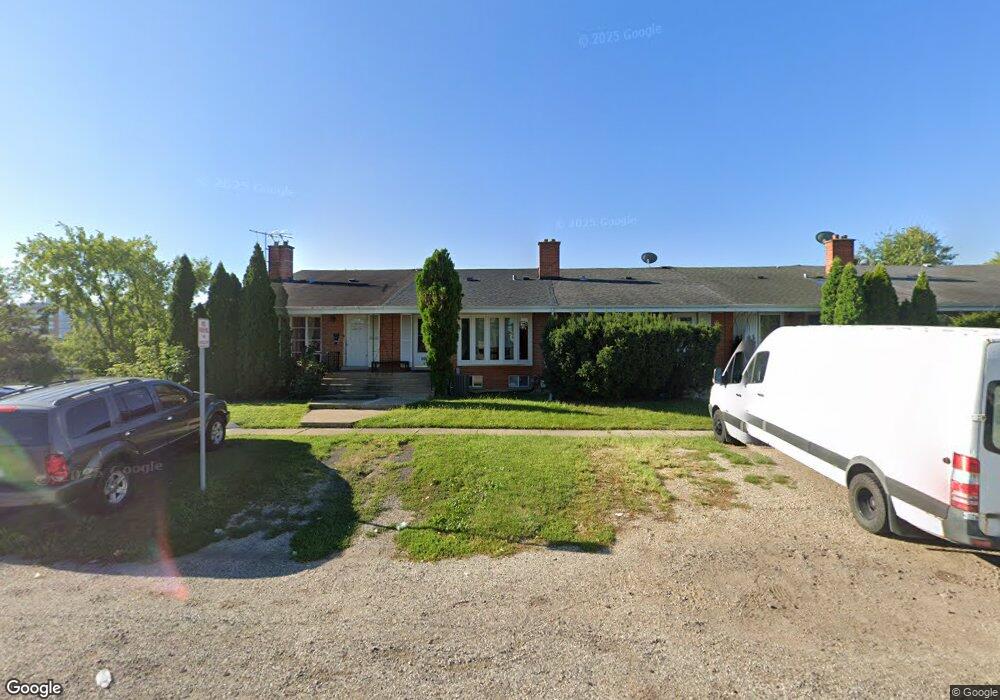
8953 Robin Dr Des Plaines, IL 60016
Estimated Value: $248,000 - $277,000
2
Beds
2
Baths
1,138
Sq Ft
$236/Sq Ft
Est. Value
About This Home
This home is located at 8953 Robin Dr, Des Plaines, IL 60016 and is currently estimated at $268,303, approximately $235 per square foot. 8953 Robin Dr is a home located in Cook County with nearby schools including Apollo Elementary School, Gemini Middle School, and Maine East High School.
Ownership History
Date
Name
Owned For
Owner Type
Purchase Details
Closed on
Nov 18, 2005
Sold by
Jankowska Zofia
Bought by
Kutman Irina and Kutman Eugene
Current Estimated Value
Home Financials for this Owner
Home Financials are based on the most recent Mortgage that was taken out on this home.
Original Mortgage
$164,800
Outstanding Balance
$92,274
Interest Rate
6.7%
Mortgage Type
New Conventional
Estimated Equity
$176,029
Purchase Details
Closed on
Dec 3, 2001
Sold by
Jankowski Jan
Bought by
Jankowska Zofia
Purchase Details
Closed on
Jun 21, 1994
Sold by
Shoykhet Leonid and Shoykhet Irina
Bought by
Jankowski Jan and Jankowski Zofia
Home Financials for this Owner
Home Financials are based on the most recent Mortgage that was taken out on this home.
Original Mortgage
$82,800
Interest Rate
8.38%
Create a Home Valuation Report for This Property
The Home Valuation Report is an in-depth analysis detailing your home's value as well as a comparison with similar homes in the area
Home Values in the Area
Average Home Value in this Area
Purchase History
| Date | Buyer | Sale Price | Title Company |
|---|---|---|---|
| Kutman Irina | $206,000 | Heritage Title Company | |
| Jankowska Zofia | -- | -- | |
| Jankowski Jan | $92,000 | -- |
Source: Public Records
Mortgage History
| Date | Status | Borrower | Loan Amount |
|---|---|---|---|
| Open | Kutman Irina | $164,800 | |
| Previous Owner | Jankowski Jan | $82,800 |
Source: Public Records
Tax History
| Year | Tax Paid | Tax Assessment Tax Assessment Total Assessment is a certain percentage of the fair market value that is determined by local assessors to be the total taxable value of land and additions on the property. | Land | Improvement |
|---|---|---|---|---|
| 2025 | $4,793 | $22,000 | $2,876 | $19,124 |
| 2024 | $4,793 | $21,000 | $3,500 | $17,500 |
| 2023 | $4,531 | $21,000 | $3,500 | $17,500 |
| 2022 | $4,531 | $21,000 | $3,500 | $17,500 |
| 2021 | $3,798 | $15,425 | $1,598 | $13,827 |
| 2020 | $4,184 | $16,745 | $1,598 | $15,147 |
| 2019 | $4,095 | $18,606 | $1,598 | $17,008 |
| 2018 | $2,723 | $12,289 | $1,398 | $10,891 |
| 2017 | $2,703 | $12,289 | $1,398 | $10,891 |
| 2016 | $3,415 | $14,565 | $1,398 | $13,167 |
| 2015 | $2,908 | $12,032 | $1,198 | $10,834 |
| 2014 | $2,823 | $12,032 | $1,198 | $10,834 |
| 2013 | $3,252 | $13,712 | $1,198 | $12,514 |
Source: Public Records
Map
Nearby Homes
- 9241 W Ballard Rd Unit 107
- 8843 Robin Dr Unit C
- 8995 Kennedy Dr Unit 206F
- 8807 Dee Rd
- 1913 Rancho Ln
- 8810 Briar Ct Unit 1B
- 2000 Parkside Dr Unit FG
- 8802 Briar Ct Unit 3A
- 9332 Landings Ln Unit 604
- 9332 Landings Ln Unit 404
- 9332 Landings Ln Unit 504
- 1710 Dempster St Unit A
- 9396 Landings Ln Unit 306
- 9396 Landings Ln Unit 302
- 9396 Landings Ln Unit 202
- 9396 Landings Ln Unit 501
- 9396 Landings Ln Unit 201
- 9396 Landings Ln Unit 401
- 9396 Landings Ln Unit 207
- 8970 N Parkside Ave Unit C408
- 8953 Robin Dr
- 8953 Robin Dr
- 8953 Robin Dr
- 8953 Robin Dr
- 8953 Robin Dr
- 8953 Robin Dr Unit E
- 8943 Robin Dr Unit B
- 8943 Robin Dr
- 8943 Robin Dr
- 8943 Robin Dr
- 8943 Robin Dr
- 8943 Robin Dr
- 8943 Robin Dr
- 8943 Robin Dr Unit F
- 8951 Robin Dr
- 8939 Robin Dr
- 8939 Robin Dr
- 8939 Robin Dr
- 8939 Robin Dr
- 8939 Robin Dr
Your Personal Tour Guide
Ask me questions while you tour the home.