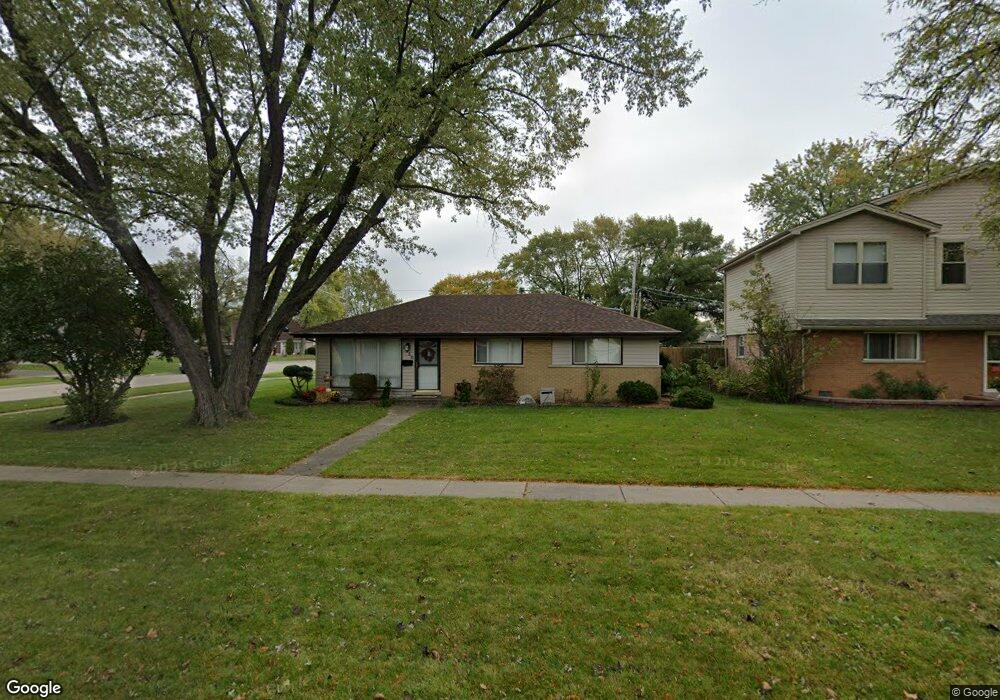
8955 Fairlane Dr Bridgeview, IL 60455
Little Palestine NeighborhoodEstimated Value: $267,798 - $285,000
3
Beds
1
Bath
1,066
Sq Ft
$258/Sq Ft
Est. Value
About This Home
This home is located at 8955 Fairlane Dr, Bridgeview, IL 60455 and is currently estimated at $274,950, approximately $257 per square foot. 8955 Fairlane Dr is a home located in Cook County with nearby schools including George W Lieb Elementary School, Simmons Middle School, and Oak Lawn Community High School.
Ownership History
Date
Name
Owned For
Owner Type
Purchase Details
Closed on
Dec 19, 2022
Sold by
Riley Richard A and Riley Candace C
Bought by
Bovarsky Seymour and Bovarsky Belinda A
Current Estimated Value
Purchase Details
Closed on
Feb 8, 2018
Sold by
Riley Richard A and Riley Candace C
Bought by
Riley Richard A and Riley Candace C
Home Financials for this Owner
Home Financials are based on the most recent Mortgage that was taken out on this home.
Original Mortgage
$100,000
Interest Rate
4.5%
Mortgage Type
New Conventional
Purchase Details
Closed on
Oct 26, 2001
Sold by
Riley Richard A and Riley Lisa L
Bought by
Riley Richard A
Purchase Details
Closed on
Sep 28, 1998
Sold by
Riley Richard A
Bought by
Riley Richard A and Riley Lisa L
Home Financials for this Owner
Home Financials are based on the most recent Mortgage that was taken out on this home.
Original Mortgage
$90,000
Interest Rate
6.98%
Create a Home Valuation Report for This Property
The Home Valuation Report is an in-depth analysis detailing your home's value as well as a comparison with similar homes in the area
Home Values in the Area
Average Home Value in this Area
Purchase History
| Date | Buyer | Sale Price | Title Company |
|---|---|---|---|
| Bovarsky Seymour | $205,000 | Fidelity National Title | |
| Riley Richard A | -- | Chicago Title | |
| Riley Richard A | -- | -- | |
| Riley Richard A | -- | Lawyers Title Insurance Corp |
Source: Public Records
Mortgage History
| Date | Status | Borrower | Loan Amount |
|---|---|---|---|
| Previous Owner | Riley Richard A | $100,000 | |
| Previous Owner | Riley Richard A | $90,000 |
Source: Public Records
Tax History
| Year | Tax Paid | Tax Assessment Tax Assessment Total Assessment is a certain percentage of the fair market value that is determined by local assessors to be the total taxable value of land and additions on the property. | Land | Improvement |
|---|---|---|---|---|
| 2025 | $4,738 | $20,000 | $4,830 | $15,170 |
| 2024 | $4,738 | $20,000 | $4,830 | $15,170 |
| 2023 | $5,154 | $20,000 | $4,830 | $15,170 |
| 2022 | $5,154 | $16,338 | $4,200 | $12,138 |
| 2021 | $5,046 | $16,337 | $4,200 | $12,137 |
| 2020 | $5,031 | $16,337 | $4,200 | $12,137 |
| 2019 | $4,864 | $16,177 | $3,780 | $12,397 |
| 2018 | $4,644 | $16,177 | $3,780 | $12,397 |
| 2017 | $4,634 | $16,177 | $3,780 | $12,397 |
| 2016 | $4,261 | $13,587 | $3,150 | $10,437 |
| 2015 | $4,019 | $13,587 | $3,150 | $10,437 |
| 2014 | $3,928 | $13,587 | $3,150 | $10,437 |
| 2013 | $4,180 | $15,660 | $3,150 | $12,510 |
Source: Public Records
Map
Nearby Homes
- 6932 W 91st St
- 6906 W 91st St
- 8912 Windsor Ln
- 8738 Newland Ave
- 8808 Cranbrook Ln
- 7101 Birch St
- 6705 W 91st Place
- 9236 Pembroke Ln
- 8719 Olympic Dr
- 6762 W 87th Place
- 6896 W 87th St Unit 3W
- 7117 W 93rd St Unit 306
- 8602 Oak Park Ave
- 7100 W 95th St Unit 111
- 9170 Crescent Ct
- 6442 W 88th St
- 9109 Crescent Ct
- 8200 Normandy Ave
- 9154 Ridgeland Ave
- 9007 Ridgeland Ave
- 9001 Fairlane Dr
- 6927 Elder Ct
- 9007 Fairlane Dr
- 6932 Elder Ct
- 6925 Elder Ct
- 8948 Fairlane Dr
- 6928 Elder Ct
- 8944 Fairlane Dr
- 8954 Fairlane Dr
- 9013 Fairlane Dr
- 8940 Fairlane Dr
- 9000 Fairlane Dr
- 6924 Elder Ct
- 6923 Elder Ct
- 6940 Olympic Dr
- 6920 Elder Ct
- 6932 Olympic Dr
- 6948 Olympic Dr
- 8936 Fairlane Dr
- 9019 Fairlane Dr
Your Personal Tour Guide
Ask me questions while you tour the home.