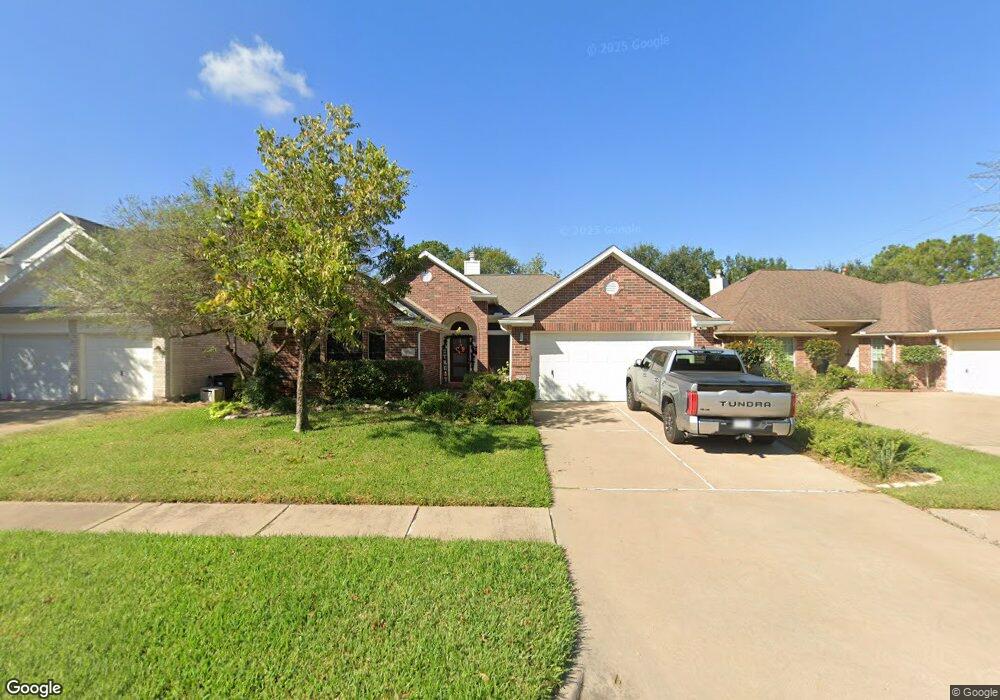
8955 Green Ray Dr Houston, TX 77095
Estimated Value: $288,272 - $320,000
3
Beds
2
Baths
1,897
Sq Ft
$159/Sq Ft
Est. Value
About This Home
This home is located at 8955 Green Ray Dr, Houston, TX 77095 and is currently estimated at $301,318, approximately $158 per square foot. 8955 Green Ray Dr is a home located in Harris County with nearby schools including Birkes Elementary School, Labay Middle School, and Cypress Falls High School.
Ownership History
Date
Name
Owned For
Owner Type
Purchase Details
Closed on
May 31, 2001
Sold by
Prudential Residential Svcs Ltd Prtnrshp
Bought by
Kopecky Michael W and Kopecky Ann K
Current Estimated Value
Home Financials for this Owner
Home Financials are based on the most recent Mortgage that was taken out on this home.
Original Mortgage
$132,900
Outstanding Balance
$50,365
Interest Rate
7.07%
Mortgage Type
FHA
Estimated Equity
$250,953
Purchase Details
Closed on
May 14, 1999
Sold by
George Wimpey Of Texas Inc
Bought by
Bartholomew Thomas L and Bartholomew Barbara J
Home Financials for this Owner
Home Financials are based on the most recent Mortgage that was taken out on this home.
Original Mortgage
$94,900
Interest Rate
6.94%
Mortgage Type
Balloon
Create a Home Valuation Report for This Property
The Home Valuation Report is an in-depth analysis detailing your home's value as well as a comparison with similar homes in the area
Home Values in the Area
Average Home Value in this Area
Purchase History
| Date | Buyer | Sale Price | Title Company |
|---|---|---|---|
| Kopecky Michael W | -- | Texas American Title Company | |
| Prudential Residential Svcs Ltd Prtnrshp | -- | Texas American Title Company | |
| Bartholomew Thomas L | -- | Texas Gulf Title Inc |
Source: Public Records
Mortgage History
| Date | Status | Borrower | Loan Amount |
|---|---|---|---|
| Open | Kopecky Michael W | $132,900 | |
| Previous Owner | Bartholomew Thomas L | $94,900 |
Source: Public Records
Tax History Compared to Growth
Tax History
| Year | Tax Paid | Tax Assessment Tax Assessment Total Assessment is a certain percentage of the fair market value that is determined by local assessors to be the total taxable value of land and additions on the property. | Land | Improvement |
|---|---|---|---|---|
| 2025 | $4,038 | $270,291 | $63,187 | $207,104 |
| 2024 | $4,038 | $273,117 | $63,187 | $209,930 |
| 2023 | $4,038 | $286,866 | $63,187 | $223,679 |
| 2022 | $5,561 | $259,083 | $48,500 | $210,583 |
| 2021 | $5,495 | $206,514 | $48,500 | $158,014 |
| 2020 | $5,463 | $216,532 | $40,303 | $176,229 |
| 2019 | $5,116 | $198,406 | $28,690 | $169,716 |
| 2018 | $1,644 | $173,966 | $28,690 | $145,276 |
| 2017 | $4,958 | $177,311 | $28,690 | $148,621 |
| 2016 | $4,642 | $166,000 | $28,690 | $137,310 |
| 2015 | $2,279 | $160,000 | $28,690 | $131,310 |
| 2014 | $2,279 | $148,485 | $24,933 | $123,552 |
Source: Public Records
Map
Nearby Homes
- 8835 Aberdeen Park Dr
- 9203 Appin Ct
- 9207 Appin Ct
- 16211 Green Smoke Dr
- 8814 Sherina Park Dr
- 16123 Aberdeen Forest Dr
- 9218 Rosewell Ct
- 8806 Gas Light Village Dr
- 16111 Aberdeen Forest Dr
- 15906 Marwick Ct
- 8818 Apple Mill Dr
- 16410 Dawnblush Ct
- 9138 Shango Ln
- 8619 Arranmore Ln
- 16403 Torry View Terrace
- 8550 Waiting Spring Ln
- 16602 Grenada Falls Dr
- 15802 Aberdeen Trails Dr
- 8550 Sparkling Springs Dr
- 16426 Torry View Terrace
- 8951 Green Ray Dr
- 8959 Green Ray Dr
- 8926 Aber Trail Ct
- 8947 Green Ray Dr
- 8930 Aber Trail Ct
- 8922 Aber Trail Ct
- 8918 Aber Trail Ct
- 8954 Green Ray Dr
- 8943 Green Ray Dr
- 8950 Green Ray Dr
- 8946 Green Ray Dr
- 8914 Aber Trail Ct
- 8939 Green Ray Dr
- 8942 Green Ray Dr
- 8910 Aber Trail Ct
- 8938 Green Ray Dr
- 8927 Aber Trail Ct
- 8931 Path Green Dr
- 8935 Path Green Dr
- 8927 Path Green Dr