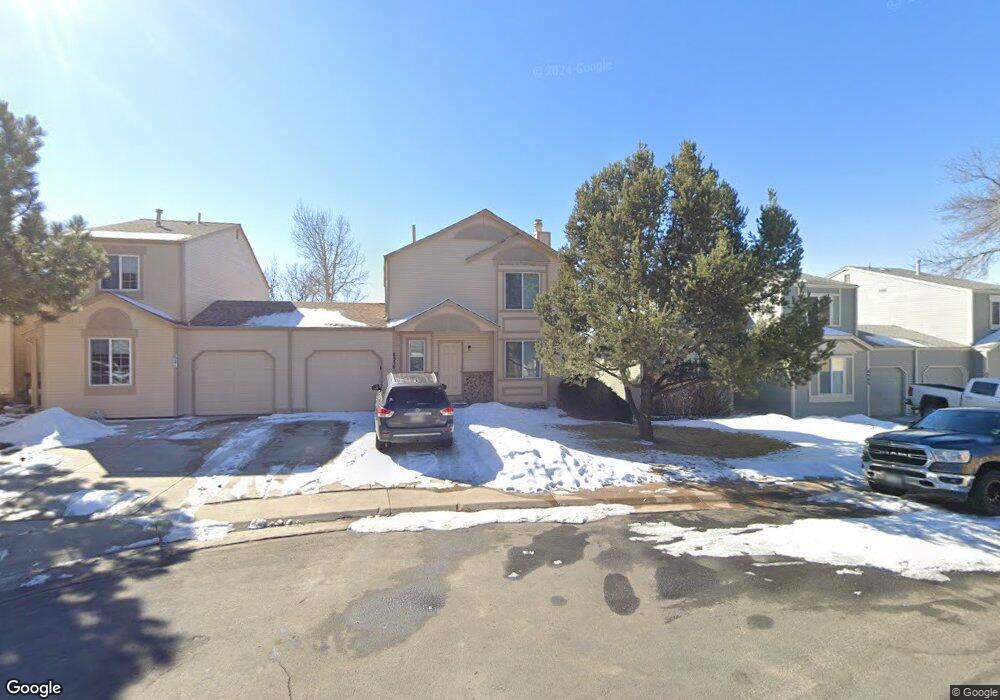
8956 W 88th Place Westminster, CO 80021
Kings Mill NeighborhoodEstimated Value: $426,000 - $466,375
3
Beds
2
Baths
1,325
Sq Ft
$340/Sq Ft
Est. Value
About This Home
This home is located at 8956 W 88th Place, Westminster, CO 80021 and is currently estimated at $450,844, approximately $340 per square foot. 8956 W 88th Place is a home located in Jefferson County with nearby schools including Weber Elementary School, Moore Middle School, and Pomona High School.
Ownership History
Date
Name
Owned For
Owner Type
Purchase Details
Closed on
Jun 7, 2019
Sold by
2019 1 Jr Borrower Lp
Bought by
2019 1 Ih Borrower Lp
Current Estimated Value
Purchase Details
Closed on
Nov 3, 2016
Sold by
Inverclyde Llc
Bought by
Csh 2016 2 Borrower Llc
Home Financials for this Owner
Home Financials are based on the most recent Mortgage that was taken out on this home.
Original Mortgage
$611,285,000
Interest Rate
3.42%
Mortgage Type
Commercial
Purchase Details
Closed on
Mar 27, 2015
Sold by
Burns William J
Bought by
Inverclyde Llc
Purchase Details
Closed on
Oct 30, 2009
Sold by
R B Ranch Inc
Bought by
Burns William J
Home Financials for this Owner
Home Financials are based on the most recent Mortgage that was taken out on this home.
Original Mortgage
$139,428
Interest Rate
5.03%
Mortgage Type
New Conventional
Purchase Details
Closed on
Jun 22, 1995
Sold by
Hud
Bought by
R B Ranch Inc and Colorado Homeless Families
Create a Home Valuation Report for This Property
The Home Valuation Report is an in-depth analysis detailing your home's value as well as a comparison with similar homes in the area
Home Values in the Area
Average Home Value in this Area
Purchase History
| Date | Buyer | Sale Price | Title Company |
|---|---|---|---|
| 2019 1 Ih Borrower Lp | -- | Os National Llc | |
| Csh 2016 2 Borrower Llc | -- | None Available | |
| Inverclyde Llc | $195,000 | Chicago Title | |
| Burns William J | $142,000 | Stewart Title | |
| R B Ranch Inc | $51,300 | Stewart Title |
Source: Public Records
Mortgage History
| Date | Status | Borrower | Loan Amount |
|---|---|---|---|
| Previous Owner | Csh 2016 2 Borrower Llc | $611,285,000 | |
| Previous Owner | Burns William J | $139,428 |
Source: Public Records
Tax History Compared to Growth
Tax History
| Year | Tax Paid | Tax Assessment Tax Assessment Total Assessment is a certain percentage of the fair market value that is determined by local assessors to be the total taxable value of land and additions on the property. | Land | Improvement |
|---|---|---|---|---|
| 2024 | $1,584 | $20,799 | $5,672 | $15,127 |
| 2023 | $1,584 | $20,799 | $5,672 | $15,127 |
| 2022 | $1,750 | $22,506 | $4,768 | $17,738 |
| 2021 | $1,776 | $23,153 | $4,905 | $18,248 |
| 2020 | $1,488 | $19,507 | $4,409 | $15,098 |
| 2019 | $1,464 | $19,507 | $4,409 | $15,098 |
| 2018 | $1,182 | $15,224 | $2,969 | $12,255 |
| 2017 | $1,058 | $15,224 | $2,969 | $12,255 |
| 2016 | $1,087 | $14,513 | $4,229 | $10,284 |
| 2015 | $551 | $14,513 | $4,229 | $10,284 |
| 2014 | $905 | $11,264 | $3,463 | $7,801 |
Source: Public Records
Map
Nearby Homes
- 8793 Dover Cir
- 8999 Field St Unit 8
- 9438 W 89th Cir
- 9411 W 89th Cir Unit 9411
- 9404 W 89th Cir Unit 9404
- 8771 Carr Loop
- 8759 W 86th Ave
- 8739 Garrison Ct
- 9051 Garland St
- 8795 W 86th Dr
- 8480 Everett Way Unit B
- 8696 W 86th Cir
- 8752 Independence Way
- 8682 Garrison Ct
- 8438 Everett Way Unit B
- 8706 W 86th Dr
- 8357 W 90th Place Unit 1703
- 8346 W 87th Dr Unit D
- 8467 Everett Way Unit E
- 8430 Everett Way Unit E
- 8946 W 88th Place
- 8966 W 88th Place
- 8976 W 88th Place
- 8892 Everett St
- 8894 Everett St
- 8986 W 88th Place
- 8896 Everett St
- 8847 Estes St
- 8996 W 88th Place
- 8837 Estes St
- 8898 Everett St
- 8995 W 88th Place
- 8857 Estes St
- 8827 Estes St
- 8997 W 88th Place
- 8998 W 88th Place
- 8900 Everett St
- 8999 W 88th Place
- 8867 Estes St
- 8817 Estes St