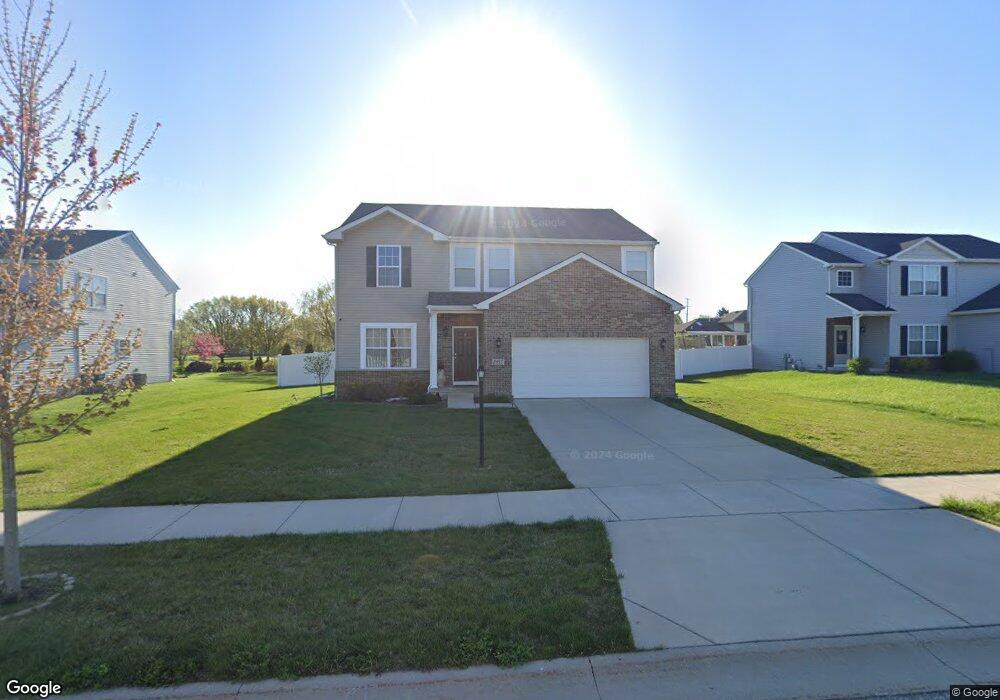
8957 Cornerstone Dr Schererville, IN 46375
Estimated Value: $411,000 - $491,000
3
Beds
3
Baths
2,009
Sq Ft
$221/Sq Ft
Est. Value
About This Home
This home is located at 8957 Cornerstone Dr, Schererville, IN 46375 and is currently estimated at $444,536, approximately $221 per square foot. 8957 Cornerstone Dr is a home located in Lake County with nearby schools including Hal E Clark Middle School, Peifer Elementary School, and Lake Central High School.
Ownership History
Date
Name
Owned For
Owner Type
Purchase Details
Closed on
Mar 19, 2018
Sold by
Providence Homes At Regency Inc
Bought by
Tirado David A and Tirado Amor
Current Estimated Value
Home Financials for this Owner
Home Financials are based on the most recent Mortgage that was taken out on this home.
Original Mortgage
$280,750
Outstanding Balance
$240,237
Interest Rate
4.32%
Mortgage Type
New Conventional
Estimated Equity
$204,299
Purchase Details
Closed on
Sep 30, 2017
Sold by
Kenney Crane Harris
Bought by
Providence Homes At Regency Inc
Purchase Details
Closed on
Jun 3, 2017
Sold by
Providence Homes At Regency Inc
Bought by
Kenney Crane Harris
Purchase Details
Closed on
May 2, 2017
Sold by
This Indenture Witnesseth Liffhous Ventu
Bought by
Providence Homes At Regency Inc
Purchase Details
Closed on
Aug 24, 2015
Sold by
Lantz Development Corp
Bought by
Lifehouse Ventures Llc
Create a Home Valuation Report for This Property
The Home Valuation Report is an in-depth analysis detailing your home's value as well as a comparison with similar homes in the area
Home Values in the Area
Average Home Value in this Area
Purchase History
| Date | Buyer | Sale Price | Title Company |
|---|---|---|---|
| Tirado David A | -- | Chicago Title Ins Co | |
| Providence Homes At Regency Inc | -- | Chicago Title Insurance Co | |
| Kenney Crane Harris | -- | Chicago Title Insurance Co | |
| Providence Homes At Regency Inc | -- | Chicago Title Insurance Co | |
| Lifehouse Ventures Llc | -- | Fidelity National Title Co |
Source: Public Records
Mortgage History
| Date | Status | Borrower | Loan Amount |
|---|---|---|---|
| Open | Tirado David A | $280,750 |
Source: Public Records
Tax History Compared to Growth
Tax History
| Year | Tax Paid | Tax Assessment Tax Assessment Total Assessment is a certain percentage of the fair market value that is determined by local assessors to be the total taxable value of land and additions on the property. | Land | Improvement |
|---|---|---|---|---|
| 2024 | $7,850 | $409,900 | $46,000 | $363,900 |
| 2023 | $3,783 | $385,500 | $46,000 | $339,500 |
| 2022 | $3,783 | $365,200 | $46,000 | $319,200 |
| 2021 | $3,483 | $344,200 | $46,000 | $298,200 |
| 2020 | $3,375 | $327,700 | $46,000 | $281,700 |
| 2019 | $3,365 | $302,500 | $33,800 | $268,700 |
| 2018 | $1,440 | $154,500 | $33,800 | $120,700 |
| 2017 | $74 | $1,500 | $1,500 | $0 |
| 2016 | $74 | $1,500 | $1,500 | $0 |
Source: Public Records
Map
Nearby Homes
- 9017 Mathews St
- 5063 W 89th Ct
- 8748 Durbin Ln
- 4944 W 89th Terrace
- 5012 W 92nd Ave
- 4862 W 92nd Ave
- 8849 Calhoun Place
- 9251 Clark Place
- 9195 Williams St
- 4229 W 92nd Place
- 6076 Wexford Way
- 9204 Wright St
- 4930 W 84th Terrace
- 6501 W 89th Ave
- 6308 W 91st Ave
- 6440 W 89th Ave
- 5547 Maggie Mae Ct
- 5544 Maggie Mae Ct
- 8903 Edison St
- 6915 W 93rd Ave
- 8957 Cornerstone Dr
- 8947 Cornerstone Dr
- 8947 Cornerstone Dr
- 8967 Cornerstone Dr
- 8967 Cornerstone Dr
- 8966 Pineview Ln
- 8977 Cornerstone Dr
- 8937 Cornerstone Dr
- 8977 Cornerstone Dr
- 8937 Cornerstone Dr
- 8980 Pineview Ln
- 8964 Cornerstone Dr
- 8964 Cornerstone Dr
- 8944 Cornerstone Dr
- 8944 Cornerstone Dr
- 8987 Cornerstone Dr
- 8987 Cornerstone Dr
- 8994 Pineview Ln
- 5364 Woodland Dr
- 5364 Woodland Dr