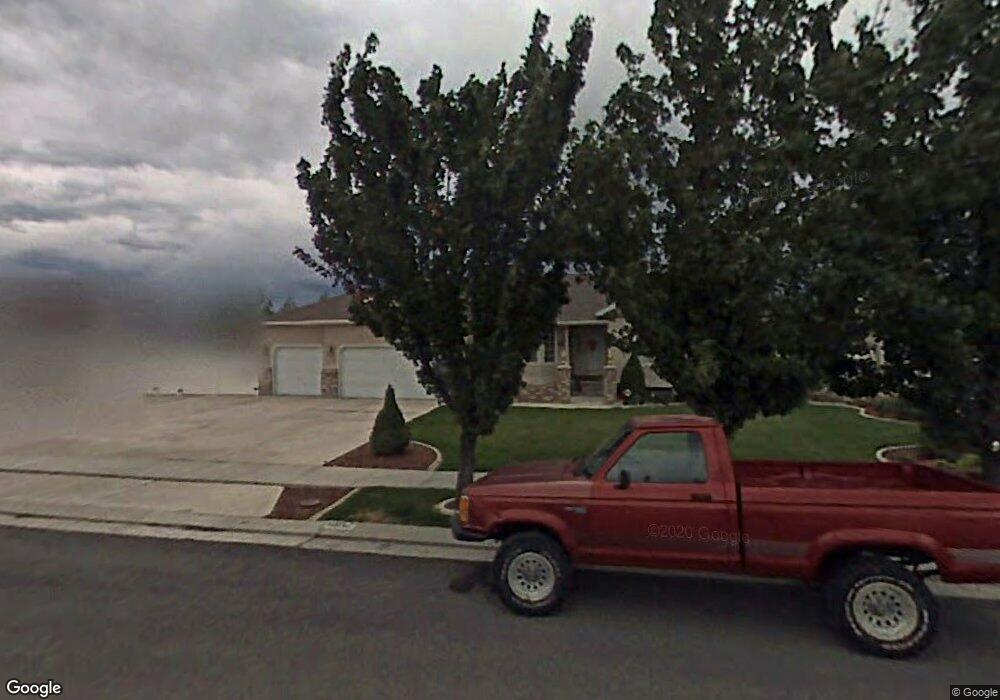
8957 S 2240 W West Jordan, UT 84088
Edenbrooke NeighborhoodEstimated Value: $665,000 - $772,000
3
Beds
3
Baths
3,674
Sq Ft
$193/Sq Ft
Est. Value
About This Home
This home is located at 8957 S 2240 W, West Jordan, UT 84088 and is currently estimated at $709,333, approximately $193 per square foot. 8957 S 2240 W is a home located in Salt Lake County with nearby schools including Westvale Elementary School, West Jordan Middle School, and West Jordan High School.
Ownership History
Date
Name
Owned For
Owner Type
Purchase Details
Closed on
Jan 29, 2001
Sold by
Dove Stacey S
Bought by
Heuser George C and Heuser Debra K
Current Estimated Value
Home Financials for this Owner
Home Financials are based on the most recent Mortgage that was taken out on this home.
Original Mortgage
$105,000
Outstanding Balance
$38,069
Interest Rate
7.13%
Estimated Equity
$671,264
Purchase Details
Closed on
Nov 28, 1997
Sold by
Guy Richard S and Guy Jane M
Bought by
Guy Richard S
Home Financials for this Owner
Home Financials are based on the most recent Mortgage that was taken out on this home.
Original Mortgage
$170,400
Interest Rate
7.31%
Purchase Details
Closed on
Feb 29, 1996
Sold by
Mcarthur Communities L C
Bought by
Guy Richard S and Guy Jane M
Home Financials for this Owner
Home Financials are based on the most recent Mortgage that was taken out on this home.
Original Mortgage
$160,000
Interest Rate
7.04%
Create a Home Valuation Report for This Property
The Home Valuation Report is an in-depth analysis detailing your home's value as well as a comparison with similar homes in the area
Home Values in the Area
Average Home Value in this Area
Purchase History
| Date | Buyer | Sale Price | Title Company |
|---|---|---|---|
| Heuser George C | -- | Metro National Title | |
| Guy Richard S | -- | -- | |
| Guy Richard S | -- | -- |
Source: Public Records
Mortgage History
| Date | Status | Borrower | Loan Amount |
|---|---|---|---|
| Open | Heuser George C | $105,000 | |
| Previous Owner | Guy Richard S | $170,400 | |
| Previous Owner | Guy Richard S | $160,000 |
Source: Public Records
Tax History Compared to Growth
Tax History
| Year | Tax Paid | Tax Assessment Tax Assessment Total Assessment is a certain percentage of the fair market value that is determined by local assessors to be the total taxable value of land and additions on the property. | Land | Improvement |
|---|---|---|---|---|
| 2025 | $3,224 | $672,200 | $186,400 | $485,800 |
| 2024 | $3,224 | $620,300 | $172,000 | $448,300 |
| 2023 | $3,273 | $593,500 | $162,200 | $431,300 |
| 2022 | $3,391 | $604,900 | $159,000 | $445,900 |
| 2021 | $2,860 | $464,500 | $128,300 | $336,200 |
| 2020 | $2,714 | $413,600 | $128,300 | $285,300 |
| 2019 | $2,746 | $410,400 | $135,000 | $275,400 |
| 2018 | $2,589 | $383,800 | $99,000 | $284,800 |
| 2017 | $2,447 | $361,200 | $99,000 | $262,200 |
| 2016 | $2,173 | $301,300 | $94,100 | $207,200 |
| 2015 | $2,127 | $287,600 | $98,500 | $189,100 |
| 2014 | $1,978 | $263,300 | $91,400 | $171,900 |
Source: Public Records
Map
Nearby Homes
- 8859 S Long Dr
- 2041 W 8820 S
- 2286 Williamsburg Cir
- 2223 W Williamsburg Cir
- 2636 W 9110 S
- 2177 W 9240 S
- 9178 Lisa Ave
- 9252 S 2040 W Unit D
- 8886 S 2700 W
- 2116 W Abbey View Rd
- 1773 W 8760 S
- 1968 W 9270 S Unit C
- 8461 S 2385 W
- 4000 W 8400 S Unit 83
- 2097 Jordan Villa Dr
- 77 Rio Bravo Place
- 8383 S 2200 W
- 9294 S 2700 W
- 9414 S 1980 W
- 1633 W Rockaway Ln