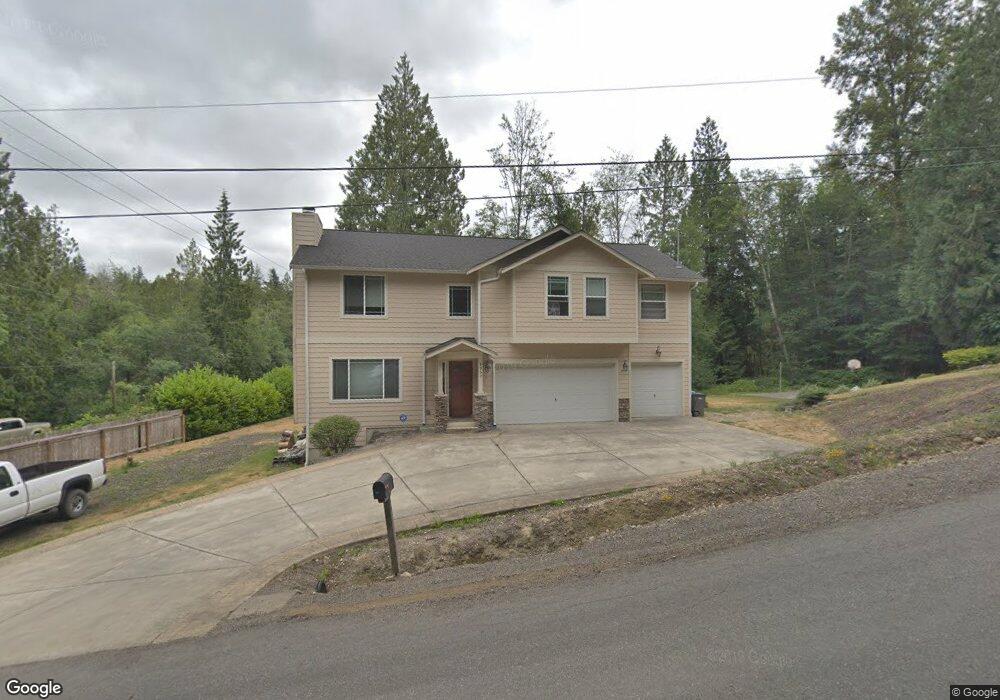
8957 Wyvern Dr SE Port Orchard, WA 98367
Estimated Value: $690,000 - $743,000
3
Beds
3
Baths
2,189
Sq Ft
$326/Sq Ft
Est. Value
About This Home
This home is located at 8957 Wyvern Dr SE, Port Orchard, WA 98367 and is currently estimated at $714,269, approximately $326 per square foot. 8957 Wyvern Dr SE is a home located in Kitsap County with nearby schools including Mullenix Ridge Elementary School, John Sedgwick Middle School, and South Kitsap High School.
Ownership History
Date
Name
Owned For
Owner Type
Purchase Details
Closed on
May 2, 2007
Sold by
Property Maintenance Construction Inc
Bought by
Zimny Paul N and Zimny Roxane M
Current Estimated Value
Home Financials for this Owner
Home Financials are based on the most recent Mortgage that was taken out on this home.
Original Mortgage
$38,800
Interest Rate
6.17%
Mortgage Type
Unknown
Purchase Details
Closed on
Mar 21, 2005
Sold by
Coleman John W
Bought by
Property Maintenance Construction Inc
Home Financials for this Owner
Home Financials are based on the most recent Mortgage that was taken out on this home.
Original Mortgage
$23,250
Interest Rate
5.6%
Mortgage Type
Purchase Money Mortgage
Purchase Details
Closed on
Jun 21, 2002
Sold by
Coleman John W
Bought by
Coleman John W
Create a Home Valuation Report for This Property
The Home Valuation Report is an in-depth analysis detailing your home's value as well as a comparison with similar homes in the area
Home Values in the Area
Average Home Value in this Area
Purchase History
| Date | Buyer | Sale Price | Title Company |
|---|---|---|---|
| Zimny Paul N | $388,368 | Pacific Nw Title | |
| Property Maintenance Construction Inc | $31,000 | Pacific Nw Title | |
| Coleman John W | -- | Pacific Nw Title |
Source: Public Records
Mortgage History
| Date | Status | Borrower | Loan Amount |
|---|---|---|---|
| Closed | Zimny Paul N | $38,800 | |
| Open | Zimny Paul N | $310,450 | |
| Previous Owner | Property Maintenance Construction Inc | $23,250 |
Source: Public Records
Tax History Compared to Growth
Tax History
| Year | Tax Paid | Tax Assessment Tax Assessment Total Assessment is a certain percentage of the fair market value that is determined by local assessors to be the total taxable value of land and additions on the property. | Land | Improvement |
|---|---|---|---|---|
| 2026 | $5,355 | $614,680 | $89,210 | $525,470 |
| 2025 | $5,355 | $614,680 | $89,210 | $525,470 |
| 2024 | $5,193 | $614,680 | $89,210 | $525,470 |
| 2023 | $5,159 | $614,680 | $89,210 | $525,470 |
| 2022 | $4,929 | $491,740 | $71,370 | $420,370 |
| 2021 | $4,578 | $431,550 | $63,720 | $367,830 |
| 2020 | $4,599 | $421,450 | $51,870 | $369,580 |
| 2019 | $3,886 | $390,560 | $48,130 | $342,430 |
| 2018 | $4,123 | $317,100 | $43,570 | $273,530 |
| 2017 | $3,479 | $317,100 | $43,570 | $273,530 |
| 2016 | $3,354 | $279,530 | $41,500 | $238,030 |
| 2015 | $3,237 | $273,270 | $41,500 | $231,770 |
| 2014 | -- | $243,630 | $41,970 | $201,660 |
| 2013 | -- | $243,630 | $41,970 | $201,660 |
Source: Public Records
Map
Nearby Homes
- 8964 Lawrence Dr SE
- 8610 Long Lake Rd SE
- 9175 Lawrence Dr SE
- 8817 Clearwater Ln SE
- 0 Long Lake Rd SE Unit NWM2439154
- 0 Long Lake Rd SE Unit NWM2354075
- 9535 Olalla Valley Rd SE
- 8423 Dormar Dr SE
- 4141 SW Muller Ln
- 10532 Olalla Valley Rd SE
- 10455 Woodchuck Ln SE
- 7443 Clover Valley Rd SE
- 10829 Olalla Valley Rd SE
- 6814 Darla Ln SE
- 4122 SW Muller Ln Unit 311
- 9045 SE Fragaria Rd
- 7258 SE Fragaria Rd
- 9904 Banner Rd SE
- 7776 SE Fragaria Rd
- 3371 SE Bielmeier Rd Unit 85
- 570 SE Mullenix Rd
- 8958 Wyvern
- 8958 Wyvern Dr SE
- 8970 Wyvern Dr SE
- 5220 SE Mullenix Rd
- 8969 Wyvern Dr SE
- 9030 Wyvern Dr SE
- 9040 Wyvern Dr SE
- 9050 Wyvern Dr SE
- 8994 Wyvern Dr SE
- 9010 Wyvern Dr SE
- 2029 Wyvern Dr SE
- 9020 Wyvern Dr SE
- 9060 Wyvern Court St SE
- 9060 Wyvern Dr SE
- 8981 Wyvern Dr SE
- 9049 Wyvern Dr SE
- 5120 SE Mullenix Rd
- 8754 Long Lake Rd SE
- 8706 Long Lake Rd SE