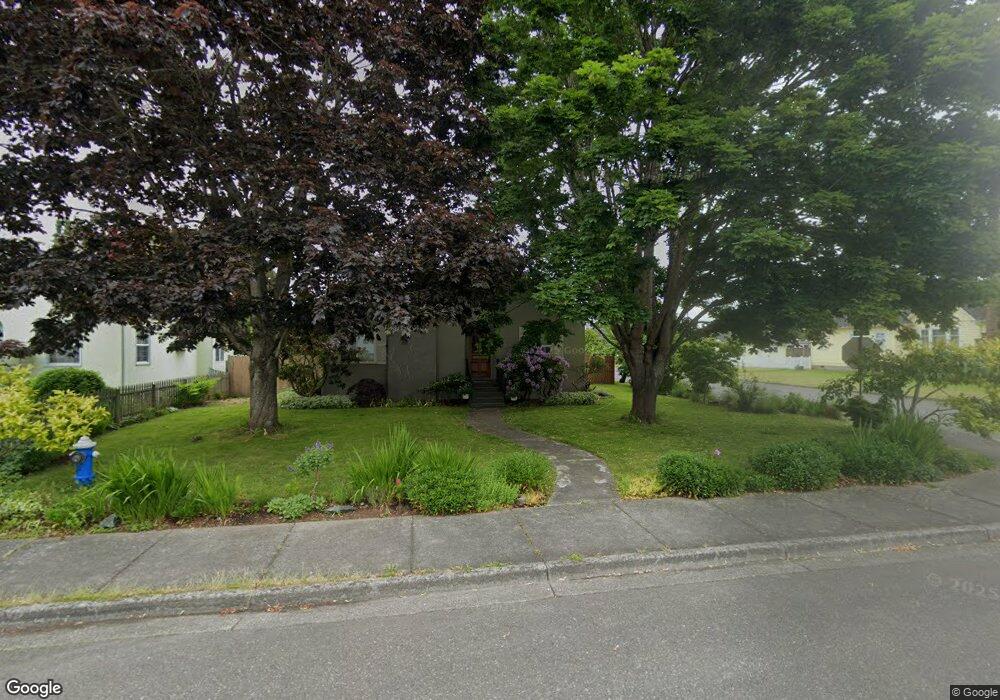
896 4th St Blaine, WA 98230
Estimated Value: $443,000 - $488,000
3
Beds
2
Baths
1,090
Sq Ft
$419/Sq Ft
Est. Value
About This Home
This home is located at 896 4th St, Blaine, WA 98230 and is currently estimated at $456,690, approximately $418 per square foot. 896 4th St is a home located in Whatcom County with nearby schools including Blaine Primary School, Blaine Elementary School, and Blaine Middle School.
Ownership History
Date
Name
Owned For
Owner Type
Purchase Details
Closed on
Jan 29, 2019
Sold by
Coffey Amy Marie
Bought by
Coffey Michael Sean
Current Estimated Value
Purchase Details
Closed on
Dec 1, 2006
Sold by
Reid Keith L and Reid Shirley L
Bought by
Coffey Michael S and Coffey Amy M
Home Financials for this Owner
Home Financials are based on the most recent Mortgage that was taken out on this home.
Original Mortgage
$216,000
Outstanding Balance
$129,571
Interest Rate
6.37%
Mortgage Type
Purchase Money Mortgage
Estimated Equity
$327,119
Purchase Details
Closed on
May 5, 2004
Sold by
Matlewsky Jeffery A and Matlewsky Eden A
Bought by
Reid Keith and Reid Shirley
Home Financials for this Owner
Home Financials are based on the most recent Mortgage that was taken out on this home.
Original Mortgage
$120,000
Interest Rate
5.38%
Mortgage Type
Purchase Money Mortgage
Create a Home Valuation Report for This Property
The Home Valuation Report is an in-depth analysis detailing your home's value as well as a comparison with similar homes in the area
Home Values in the Area
Average Home Value in this Area
Purchase History
| Date | Buyer | Sale Price | Title Company |
|---|---|---|---|
| Coffey Michael Sean | -- | None Available | |
| Coffey Michael S | $270,280 | Stewart Title Company | |
| Reid Keith | $175,000 | Whatcom Land Title |
Source: Public Records
Mortgage History
| Date | Status | Borrower | Loan Amount |
|---|---|---|---|
| Open | Coffey Michael S | $216,000 | |
| Previous Owner | Reid Keith | $120,000 |
Source: Public Records
Tax History Compared to Growth
Tax History
| Year | Tax Paid | Tax Assessment Tax Assessment Total Assessment is a certain percentage of the fair market value that is determined by local assessors to be the total taxable value of land and additions on the property. | Land | Improvement |
|---|---|---|---|---|
| 2024 | $2,977 | $442,015 | $133,200 | $308,815 |
| 2023 | $2,977 | $442,015 | $133,200 | $308,815 |
| 2022 | $2,608 | $398,212 | $120,000 | $278,212 |
| 2021 | $2,487 | $298,781 | $99,084 | $199,697 |
| 2020 | $2,366 | $259,810 | $86,160 | $173,650 |
| 2019 | $2,204 | $237,918 | $78,900 | $159,018 |
| 2018 | $2,048 | $216,207 | $71,700 | $144,507 |
| 2017 | $1,826 | $180,926 | $60,000 | $120,926 |
| 2016 | $1,791 | $180,926 | $60,000 | $120,926 |
| 2015 | $1,755 | $171,250 | $44,163 | $127,087 |
| 2014 | -- | $163,881 | $42,262 | $121,619 |
| 2013 | -- | $162,094 | $41,800 | $120,294 |
Source: Public Records
Map
Nearby Homes
- 159830 3rd St
- 253 Clark St
- 0 Peace Portal Dr Unit NWM2324632
- 976 Peace Portal Dr
- 549 Cherry St
- 1047 Garfield Ave
- 462 G St
- 1061 Peace Portal Dr Unit 6
- 240 G St
- 1273 4th St Unit 1 & 2
- 1260 Harrison Ave
- 1300 G St
- 547 E St
- 1332 4th St Unit 4
- 1300 Peace Portal Dr Unit 106
- 1333 Harrison Ave
- 815 Boblett St
- 1428 Peace Portal Dr
- 341 C St
- 1384 Bayview Ct Unit E1