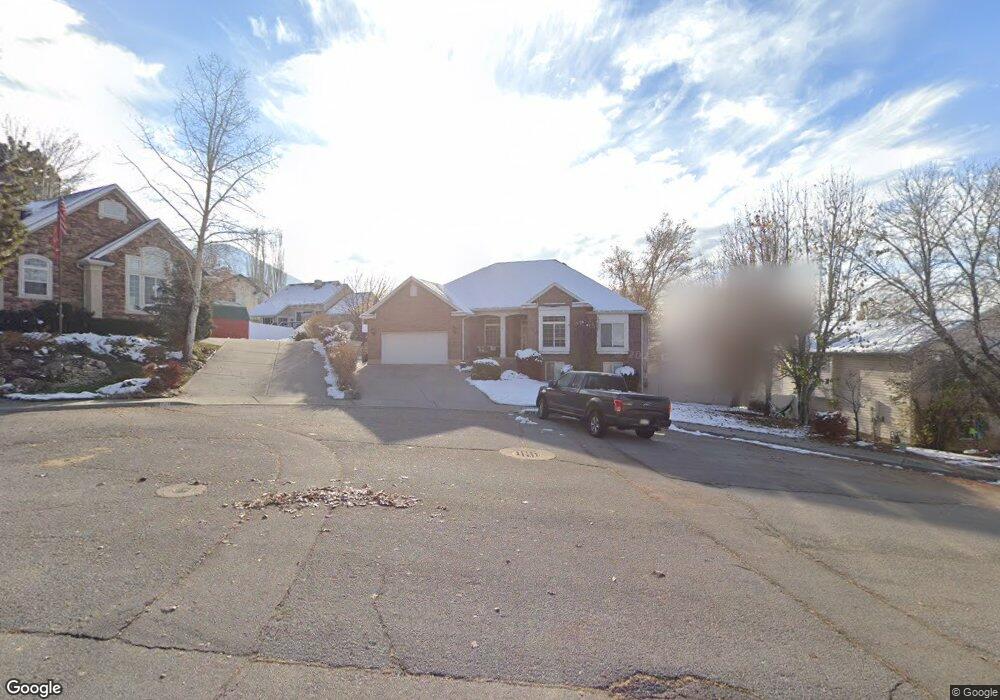
896 E 1180 N Pleasant Grove, UT 84062
Estimated Value: $652,903 - $718,000
3
Beds
3
Baths
1,958
Sq Ft
$349/Sq Ft
Est. Value
About This Home
This home is located at 896 E 1180 N, Pleasant Grove, UT 84062 and is currently estimated at $682,476, approximately $348 per square foot. 896 E 1180 N is a home located in Utah County with nearby schools including Grovecrest Elementary School, Pleasant Grove Junior High School, and Pleasant Grove High School.
Ownership History
Date
Name
Owned For
Owner Type
Purchase Details
Closed on
Sep 9, 2025
Sold by
Cattelain Gil and Cattelain Stacy J
Bought by
Gil And Stacy Cattelain Living Trust and Cattelain
Current Estimated Value
Purchase Details
Closed on
Aug 10, 2022
Sold by
Amussen J Scott
Bought by
Cattelain Gil and Cattelain Stacy J
Purchase Details
Closed on
Sep 20, 2021
Sold by
Amussen J Scott
Bought by
Cattelain Layne Gil and Cattelain Stacy J
Purchase Details
Closed on
May 27, 2021
Sold by
Wade Springs Properties Llc
Bought by
Cattelain Gil and Cattelain Stacy J
Purchase Details
Closed on
Dec 22, 1998
Sold by
All American Development & Const Lc
Bought by
Cattelain Gil and Cattelain Stacy J
Home Financials for this Owner
Home Financials are based on the most recent Mortgage that was taken out on this home.
Original Mortgage
$138,000
Interest Rate
6.91%
Create a Home Valuation Report for This Property
The Home Valuation Report is an in-depth analysis detailing your home's value as well as a comparison with similar homes in the area
Home Values in the Area
Average Home Value in this Area
Purchase History
| Date | Buyer | Sale Price | Title Company |
|---|---|---|---|
| Gil And Stacy Cattelain Living Trust | -- | None Listed On Document | |
| Cattelain Gil | -- | None Listed On Document | |
| Cattelain Layne Gil | -- | None Available | |
| Cattelain Gil | -- | None Listed On Document | |
| Cattelain Gil | -- | First American Title Co |
Source: Public Records
Mortgage History
| Date | Status | Borrower | Loan Amount |
|---|---|---|---|
| Previous Owner | Cattelain Gil | $138,000 |
Source: Public Records
Tax History Compared to Growth
Tax History
| Year | Tax Paid | Tax Assessment Tax Assessment Total Assessment is a certain percentage of the fair market value that is determined by local assessors to be the total taxable value of land and additions on the property. | Land | Improvement |
|---|---|---|---|---|
| 2025 | $286 | $339,295 | $228,100 | $388,800 |
| 2024 | $286 | $327,525 | $0 | $0 |
| 2023 | $231 | $333,960 | $0 | $0 |
| 2022 | $504 | $339,130 | $0 | $0 |
| 2021 | $2,546 | $471,200 | $163,600 | $307,600 |
| 2020 | $2,332 | $423,200 | $146,100 | $277,100 |
| 2019 | $2,116 | $397,100 | $138,800 | $258,300 |
| 2018 | $2,080 | $369,100 | $131,500 | $237,600 |
| 2017 | $1,984 | $187,385 | $0 | $0 |
| 2016 | $1,952 | $178,035 | $0 | $0 |
| 2015 | $2,042 | $176,330 | $0 | $0 |
| 2014 | $1,951 | $166,925 | $0 | $0 |
Source: Public Records
Map
Nearby Homes
- 1192 N 730 E
- 1085 E Grove Creek Dr
- 540 E 990 N
- 641 E 700 N
- 482 Canyon View Ln
- 1022 E Hillside Dr Unit 233
- 575 E 500 N
- 428 N 1180 E
- 429 E 1600 N
- 1699 N Siena Cir Unit 5
- 1791 N Siena Cir Unit 1
- 1018 E 300 S Unit 2
- 1792 N Siena Cir Unit 13
- 1012 E 300 S Unit 3
- 344 E 900 N
- 825 N 350 E
- 1161 E 200 N
- 525 E 200 N
- 348 N 1350 E
- 612 E 100 N