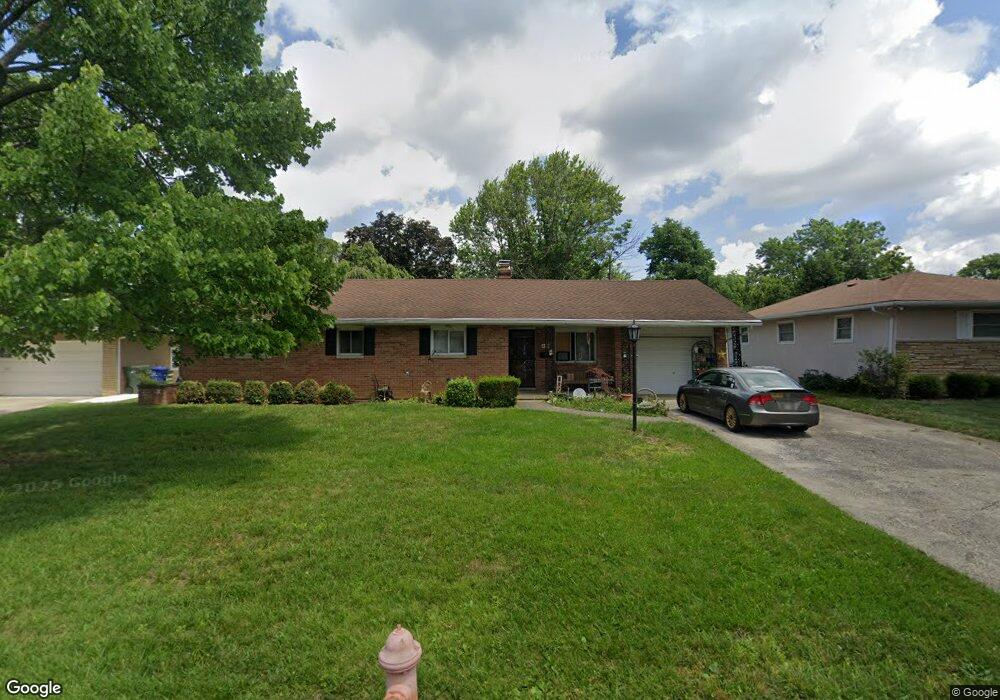
896 Janet Dr Columbus, OH 43224
North Linden NeighborhoodEstimated Value: $225,000 - $280,000
3
Beds
2
Baths
1,327
Sq Ft
$193/Sq Ft
Est. Value
About This Home
This home is located at 896 Janet Dr, Columbus, OH 43224 and is currently estimated at $255,563, approximately $192 per square foot. 896 Janet Dr is a home located in Franklin County with nearby schools including Maize Road Elementary School, Medina Middle School, and Mifflin High School.
Ownership History
Date
Name
Owned For
Owner Type
Purchase Details
Closed on
Apr 6, 2021
Sold by
Estate Of Philip D Jenkins
Bought by
Jenkins Kimberly K
Current Estimated Value
Purchase Details
Closed on
Jul 26, 2002
Sold by
Grosse Michele C and Chandler Ruth C
Bought by
Jenkins Philip D and Jenkins Barbara E
Purchase Details
Closed on
Aug 31, 1970
Bought by
Chandler Charles C
Create a Home Valuation Report for This Property
The Home Valuation Report is an in-depth analysis detailing your home's value as well as a comparison with similar homes in the area
Home Values in the Area
Average Home Value in this Area
Purchase History
| Date | Buyer | Sale Price | Title Company |
|---|---|---|---|
| Jenkins Kimberly K | -- | None Available | |
| Jenkins Philip D | $99,000 | The Title Link | |
| Chandler Charles C | -- | -- |
Source: Public Records
Tax History Compared to Growth
Tax History
| Year | Tax Paid | Tax Assessment Tax Assessment Total Assessment is a certain percentage of the fair market value that is determined by local assessors to be the total taxable value of land and additions on the property. | Land | Improvement |
|---|---|---|---|---|
| 2024 | $9,666 | $70,670 | $18,900 | $51,770 |
| 2023 | $3,131 | $70,665 | $18,900 | $51,765 |
| 2022 | $6,431 | $49,040 | $9,840 | $39,200 |
| 2021 | $2,611 | $49,040 | $9,840 | $39,200 |
| 2020 | $2,096 | $49,040 | $9,840 | $39,200 |
| 2019 | $1,816 | $38,680 | $7,880 | $30,800 |
| 2018 | $1,649 | $38,680 | $7,880 | $30,800 |
| 2017 | $1,815 | $38,680 | $7,880 | $30,800 |
| 2016 | $1,637 | $33,460 | $7,210 | $26,250 |
| 2015 | $1,486 | $33,460 | $7,210 | $26,250 |
| 2014 | $1,490 | $33,460 | $7,210 | $26,250 |
| 2013 | $787 | $35,210 | $7,595 | $27,615 |
Source: Public Records
Map
Nearby Homes
- 995 Overbrook Service Dr
- 924 Northridge Rd
- 3724 Eisenhower Rd
- 3808 Maize Rd
- 4000 Indianola Ave
- 780 Moon Rd
- 1064 Hillsdale Dr
- 685 Yaronia Dr N
- 886 Carolyn Ave
- 814 Meadowview Dr
- 876 Lenore Ave
- 4193 Eastlea Dr
- 541 Northridge Rd
- 1090 Pauline Ave
- 587 Richards Rd
- 1130 Carbone Dr
- 3480 Maize Rd
- 3476 Beulah Rd
- 540 Fallis Rd
- 1191 Bryson Rd
- 886 Janet Dr
- 906 Janet Dr
- 903 Overbrook Service Dr
- 895 Overbrook Service Dr
- 913 Overbrook Service Dr
- 876 Janet Dr
- 916 Janet Dr
- 883 Overbrook Service Dr
- 921 Overbrook Service Dr
- 885 Janet Dr
- 905 Janet Dr
- 0 Overbrook Service Dr Unit 216017521
- 0 Overbrook Service Dr
- 868 Janet Dr
- 926 Janet Dr
- 875 Janet Dr
- 915 Janet Dr
- 875 Overbrook Service Dr
- 3939 Eisenhower Rd
- 867 Janet Dr