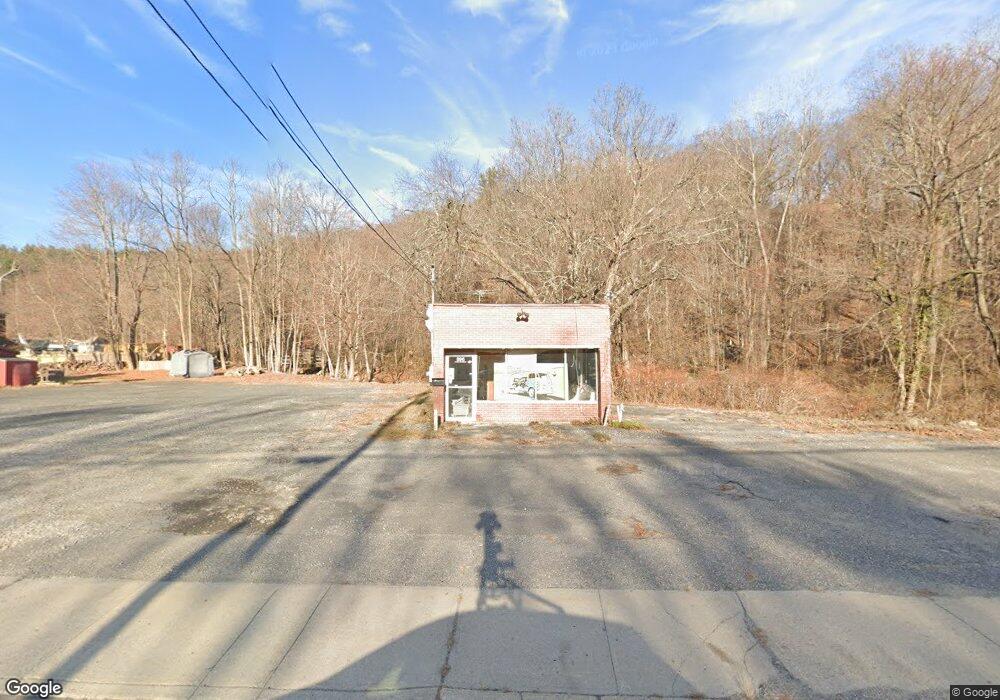
896 Main St Winsted, CT 06098
Estimated Value: $294,166
Studio
--
Bath
648
Sq Ft
$454/Sq Ft
Est. Value
About This Home
This home is located at 896 Main St, Winsted, CT 06098 and is currently priced at $294,166, approximately $453 per square foot. 896 Main St is a home located in Litchfield County with nearby schools including Pearson School, Explorations Charter School, and St Anthony School.
Ownership History
Date
Name
Owned For
Owner Type
Purchase Details
Closed on
Jul 18, 2025
Sold by
Malu Holdings Llc
Bought by
Gar Don Holdings Llc
Current Estimated Value
Purchase Details
Closed on
Feb 9, 2022
Sold by
Perugini Robert and Perugini Robert J
Bought by
Malu Holdings Llc
Purchase Details
Closed on
May 2, 2002
Sold by
Monument Rlty Inc
Bought by
Meadow Brook Dev Llc
Home Financials for this Owner
Home Financials are based on the most recent Mortgage that was taken out on this home.
Original Mortgage
$50,000
Interest Rate
7.13%
Mortgage Type
Commercial
Create a Home Valuation Report for This Property
The Home Valuation Report is an in-depth analysis detailing your home's value as well as a comparison with similar homes in the area
Home Values in the Area
Average Home Value in this Area
Purchase History
We collect this data history from publicly available records. To have your information removed, we recommend requesting removal directly through your county’s website.
| Date | Buyer | Sale Price | Title Company |
|---|---|---|---|
| Gar Don Holdings Llc | $250,000 | -- | |
| Malu Holdings Llc | $265,000 | None Available | |
| Malu Holdings Llc | $265,000 | None Available | |
| Malu Holdings Llc | $265,000 | None Available | |
| Meadow Brook Dev Llc | $50,000 | -- | |
| Meadow Brook Dev Llc | $50,000 | -- |
Source: Public Records
Mortgage History
We collect this data history from publicly available records. To have your information removed, we recommend requesting removal directly through your county’s website.
| Date | Status | Borrower | Loan Amount |
|---|---|---|---|
| Previous Owner | Meadow Brook Dev Llc | $50,000 |
Source: Public Records
Tax History
| Year | Tax Paid | Tax Assessment Tax Assessment Total Assessment is a certain percentage of the fair market value that is determined by local assessors to be the total taxable value of land and additions on the property. | Land | Improvement |
|---|---|---|---|---|
| 2025 | $2,171 | $74,410 | $44,380 | $30,030 |
| 2024 | $2,027 | $74,410 | $44,380 | $30,030 |
| 2023 | $1,964 | $74,410 | $44,380 | $30,030 |
| 2022 | $1,768 | $52,710 | $39,690 | $13,020 |
| 2021 | $1,768 | $52,710 | $39,690 | $13,020 |
| 2020 | $1,768 | $52,710 | $39,690 | $13,020 |
| 2019 | $1,768 | $52,710 | $39,690 | $13,020 |
| 2018 | $1,768 | $52,710 | $39,690 | $13,020 |
| 2017 | $2,540 | $75,740 | $56,490 | $19,250 |
| 2016 | $2,651 | $79,030 | $56,490 | $22,540 |
| 2015 | $2,584 | $79,030 | $56,490 | $22,540 |
| 2014 | $2,522 | $79,030 | $56,490 | $22,540 |
Source: Public Records
Map
Nearby Homes
Your Personal Tour Guide
Ask me questions while you tour the home.