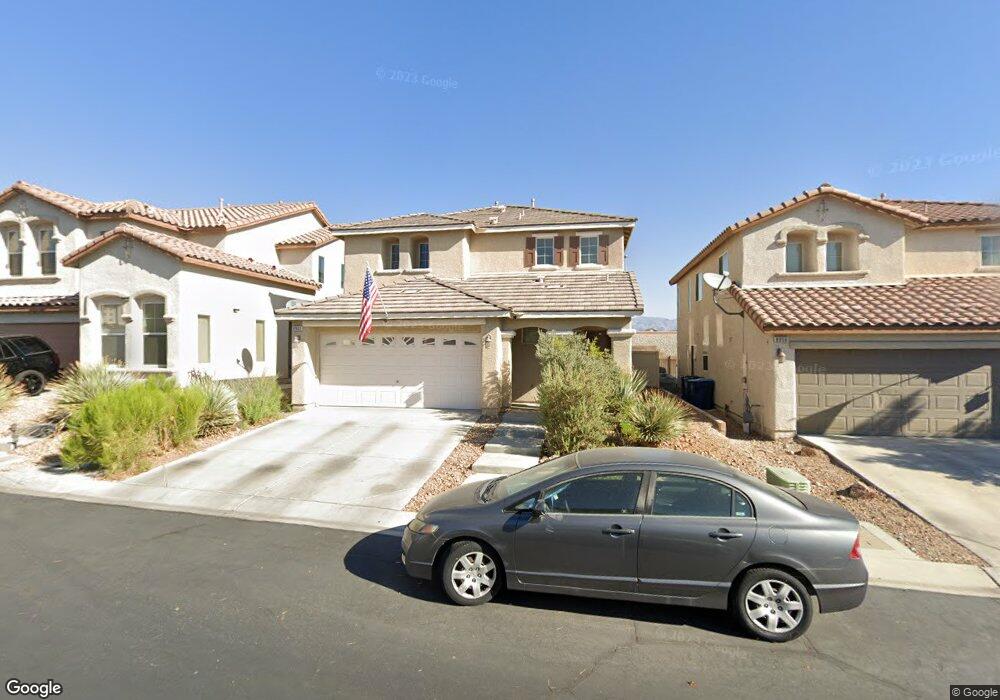
8962 Ryan Creek Ave Las Vegas, NV 89149
Estimated Value: $416,902 - $443,000
3
Beds
3
Baths
1,830
Sq Ft
$234/Sq Ft
Est. Value
About This Home
This home is located at 8962 Ryan Creek Ave, Las Vegas, NV 89149 and is currently estimated at $428,726, approximately $234 per square foot. 8962 Ryan Creek Ave is a home located in Clark County with nearby schools including Marshall C. Darnell Elementary School, Edmundo "Eddie" Escobedo, Sr. Middle School, and Centennial High School.
Ownership History
Date
Name
Owned For
Owner Type
Purchase Details
Closed on
Nov 26, 2008
Sold by
Federal Home Loan Mortgage Corporation
Bought by
Serrano Lynette S
Current Estimated Value
Home Financials for this Owner
Home Financials are based on the most recent Mortgage that was taken out on this home.
Original Mortgage
$171,733
Outstanding Balance
$114,795
Interest Rate
6.37%
Mortgage Type
FHA
Estimated Equity
$313,931
Purchase Details
Closed on
Aug 1, 2008
Sold by
Tolbert Arlin and Tolbert Kim
Bought by
Federal Home Loan Mortgage Corporation
Purchase Details
Closed on
May 30, 2006
Sold by
Richmond American Homes Of Nevada Inc
Bought by
Tolbert Arlin and Tolbert Kim
Home Financials for this Owner
Home Financials are based on the most recent Mortgage that was taken out on this home.
Original Mortgage
$239,737
Interest Rate
6.46%
Mortgage Type
Fannie Mae Freddie Mac
Create a Home Valuation Report for This Property
The Home Valuation Report is an in-depth analysis detailing your home's value as well as a comparison with similar homes in the area
Home Values in the Area
Average Home Value in this Area
Purchase History
| Date | Buyer | Sale Price | Title Company |
|---|---|---|---|
| Serrano Lynette S | $174,000 | Lsi Title Company | |
| Federal Home Loan Mortgage Corporation | $220,000 | Lsi Title Agency Inc | |
| Tolbert Arlin | $299,672 | Stewart Title Of Nevada |
Source: Public Records
Mortgage History
| Date | Status | Borrower | Loan Amount |
|---|---|---|---|
| Open | Serrano Lynette S | $171,733 | |
| Previous Owner | Tolbert Arlin | $239,737 |
Source: Public Records
Tax History Compared to Growth
Tax History
| Year | Tax Paid | Tax Assessment Tax Assessment Total Assessment is a certain percentage of the fair market value that is determined by local assessors to be the total taxable value of land and additions on the property. | Land | Improvement |
|---|---|---|---|---|
| 2025 | $1,556 | $113,584 | $33,600 | $79,984 |
| 2024 | $1,511 | $113,584 | $33,600 | $79,984 |
| 2023 | $1,511 | $108,063 | $32,900 | $75,163 |
| 2022 | $1,608 | $95,285 | $26,600 | $68,685 |
| 2021 | $1,489 | $89,558 | $24,500 | $65,058 |
| 2020 | $1,380 | $88,874 | $24,500 | $64,374 |
| 2019 | $1,293 | $83,560 | $20,300 | $63,260 |
| 2018 | $1,234 | $77,006 | $16,450 | $60,556 |
| 2017 | $1,915 | $70,227 | $15,050 | $55,177 |
| 2016 | $1,156 | $56,150 | $11,550 | $44,600 |
| 2015 | $1,153 | $43,080 | $7,000 | $36,080 |
| 2014 | $1,119 | $40,011 | $5,250 | $34,761 |
Source: Public Records
Map
Nearby Homes
- 0 N Miller Unit 2686157
- 5889 N Shaumber Rd
- 0 Tropical Pkwy Unit 2720666
- 0 N Miller Unit 2686151
- 6617 Breakwater Reef St
- 6630 Rocky Reef St
- 6619 Salt Pond Bay St
- 6315 N El Capitan Way
- 8888 Steven Chase Ct
- 6324 Zephyr Peak Ct
- 6348 Zephyr Peak Ct
- 5975 N El Capitan Way
- 6312 Zephyr Peak Ct
- 8925 Silent Brook Ct
- 6230 Calm Brook Ct
- 6749 Browns Bay Ct
- 6196 Serenity Bluffs St
- 0 Durango and Centennial
- 0 Azure & Campbell Unit 2736259
- 9148 Patrick Henry Ave
- 8956 Ryan Creek Ave
- 8968 Ryan Creek Ave
- 8950 Ryan Creek Ave Unit none
- 8950 Ryan Creek Ave
- 8974 Ryan Creek Ave
- 8961 Ryan Creek Ave
- 8961 Ryan Creek Ave Unit none
- 8967 Ryan Creek Ave
- 8944 Ryan Creek Ave
- 8980 Ryan Creek Ave
- 8955 Ryan Creek Ave
- 6476 Sean Creek St Unit n/a
- 6476 Sean Creek St
- 8949 Ryan Creek Ave Unit n/a
- 8949 Ryan Creek Ave
- 8938 Ryan Creek Ave
- 6470 Sean Creek St
- 8986 Ryan Creek Ave
- 8943 Ryan Creek Ave
- 8970 Candice Creek Ct