8963 8963 Complex San Diego, CA 92123
Kearny Mesa NeighborhoodEstimated Value: $791,302
About This Home
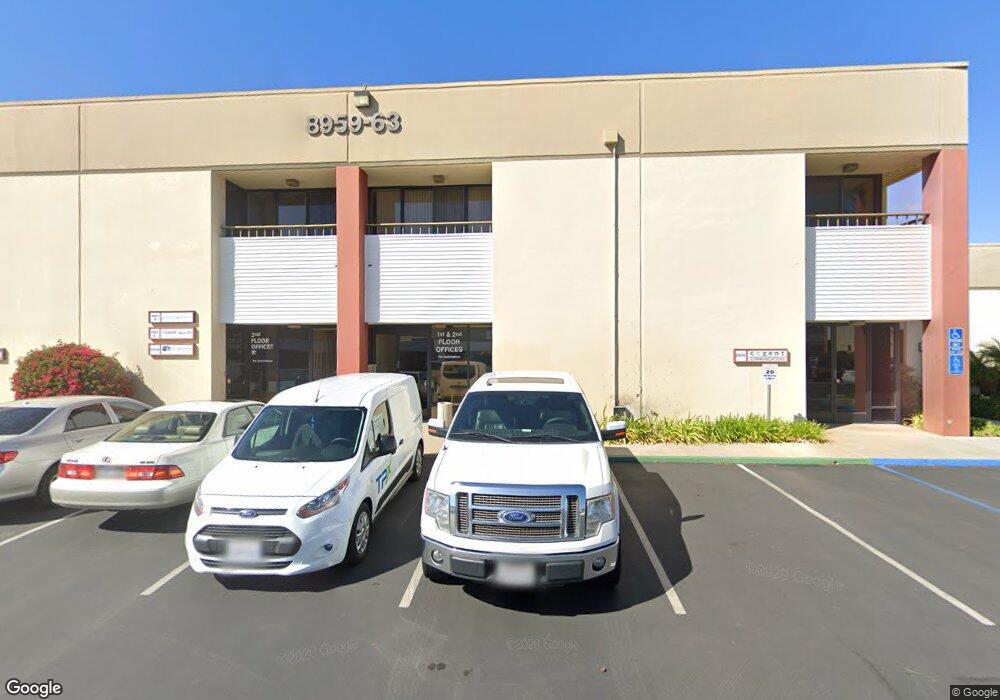
This home is located at 8963 8963 Complex, San Diego, CA 92123 and is currently estimated at $791,302, approximately $425 per square foot. 8963 8963 Complex is a home located in San Diego County with nearby schools including Wegeforth Elementary School, Taft Middle School, and School for Entrepreneurship and Technology.
Ownership History
We collect this data history from publicly available records. To have your information removed, we recommend requesting removal directly through your county’s website.
Purchase Details
Home Financials for this Owner
Home Financials are based on the most recent Mortgage that was taken out on this home.Purchase Details
Purchase Details
Home Financials for this Owner
Home Financials are based on the most recent Mortgage that was taken out on this home.Purchase Details
Home Values in the Area
Average Home Value in this Area
Purchase History
We collect this data history from publicly available records. To have your information removed, we recommend requesting removal directly through your county’s website.
| Date | Buyer | Sale Price | Title Company |
|---|---|---|---|
| $443,000 | Ticor Title Company Of Ca | ||
| -- | Accommodation | ||
| $553,000 | Old Republic Title Company | ||
| -- | Chicago Title Company |
Mortgage History
We collect this data history from publicly available records. To have your information removed, we recommend requesting removal directly through your county’s website.
| Date | Status | Borrower | Loan Amount |
|---|---|---|---|
| Open | $350,000 | ||
| Previous Owner | $300,000 |
Tax History
We collect this data history from publicly available records. To have your information removed, we recommend requesting removal directly through your county’s website.
| Year | Tax Paid | Tax Assessment Tax Assessment Total Assessment is a certain percentage of the fair market value that is determined by local assessors to be the total taxable value of land and additions on the property. | Land | Improvement |
|---|---|---|---|---|
| 2025 | $6,220 | $514,132 | $208,902 | $305,230 |
| 2024 | $6,220 | $504,052 | $204,806 | $299,246 |
| 2023 | $6,083 | $494,170 | $200,791 | $293,379 |
| 2022 | $5,922 | $484,481 | $196,854 | $287,627 |
| 2021 | $5,881 | $474,983 | $192,995 | $281,988 |
| 2020 | $5,810 | $470,114 | $191,017 | $279,097 |
| 2019 | $5,707 | $460,897 | $187,272 | $273,625 |
| 2018 | $5,336 | $451,860 | $183,600 | $268,260 |
| 2017 | $5,210 | $443,000 | $180,000 | $263,000 |
| 2016 | $7,108 | $602,991 | $239,887 | $363,104 |
| 2015 | $7,003 | $593,934 | $236,284 | $357,650 |
| 2014 | $6,893 | $582,301 | $231,656 | $350,645 |
Map
- 8877 Tribeca Cir
- 5560 Kearny Mesa Rd
- 9719 Caminito Del Marfil
- 9810 Guisante Terrace
- 5232 Quemado Ct
- 6460 Convoy #271 Ct
- 10150 Gayuba Ln
- 9209 Villiage Unit 146
- 8884 Haveteur Way
- 3591 Ruffin Rd Unit 125
- 3550 Ruffin Rd Unit 182
- 3456 Castle Glen Dr Unit 273
- 10328 Amaro Ct
- 8835 Halsted St
- 8514 Glenhaven St
- 9249 Village Glen Dr Unit 102
- 8573-79 Glenhaven St
- 9149 Village Glen Dr Unit 179
- 9289 Village Glen Dr Unit 118
- 9209 Village Glen Dr Unit 143
- 8911 8911 Complex Dr
- 8947 Complex Dr
- 8947 8947 Complex Drive Ste B
- 8911 Complex Dr
- 8947 8947 Complex Dr
- 8947 Complex Dr
- 8949 Complex Dr
- 8949 Complex Dr
- 8949 Complex Dr Unit B
- 8947 Complex Dr
- 8947 8947 Complex Dr Ste A
- 8947 8947 Complex Drive Ste A
- 8947 8947 Complex Dr Ste A & B
- 8949 A 8949 A Complex Dr
- 8963 Complex Dr
- 8963 Complex Dr
- 8947 A & B 8947 A & B Complex Dr
- 8947-49 8947-49 Complex Dr
- 9070 Lightwave Ave
- 8945 Complex Dr
Ask me questions while you tour the home.