Estimated Value: $491,000 - $554,000
4
Beds
2
Baths
2,430
Sq Ft
$214/Sq Ft
Est. Value
About This Home
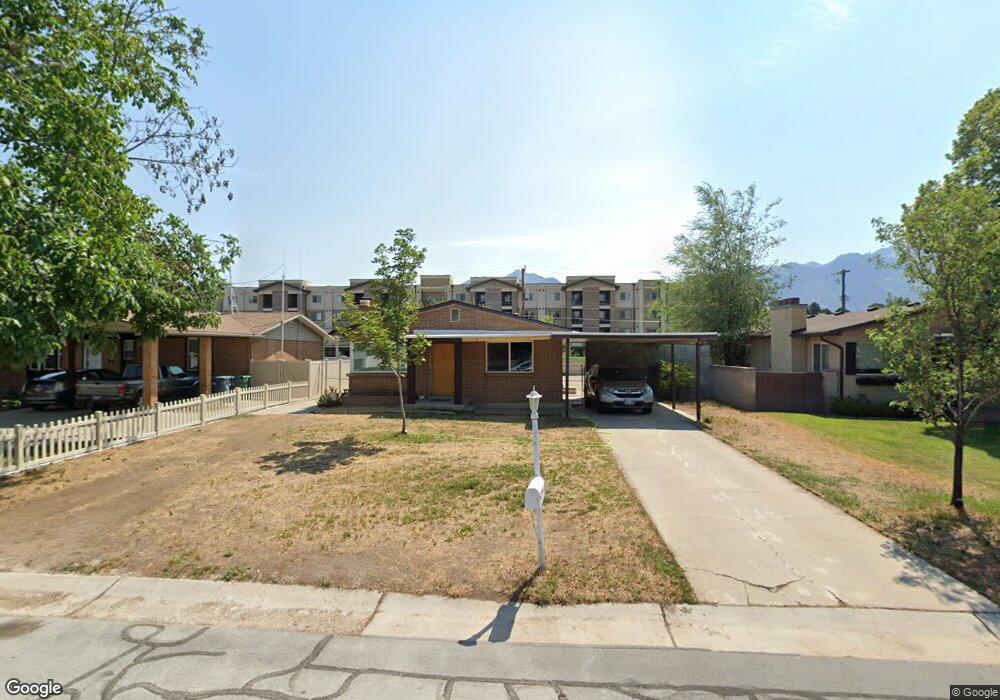
This home is located at 8963 S Mingo Park Dr, Sandy, UT 84070 and is currently estimated at $520,000, approximately $213 per square foot. 8963 S Mingo Park Dr is a home located in Salt Lake County with nearby schools including Sandy Elementary School, Mount Jordan Middle School, and Jordan High.
Ownership History
Date
Name
Owned For
Owner Type
Purchase Details
Closed on
Apr 12, 2021
Sold by
Ramos Anthony Leroy and De Santiago Mayrax
Bought by
Williams Angelique R
Current Estimated Value
Home Financials for this Owner
Home Financials are based on the most recent Mortgage that was taken out on this home.
Original Mortgage
$320,000
Outstanding Balance
$286,652
Interest Rate
3.05%
Mortgage Type
New Conventional
Estimated Equity
$233,348
Purchase Details
Closed on
Jun 1, 2020
Sold by
Ramos Anthony L
Bought by
Ramos Anthony Leroy and Desantiago Mayra
Home Financials for this Owner
Home Financials are based on the most recent Mortgage that was taken out on this home.
Original Mortgage
$192,500
Interest Rate
3.2%
Mortgage Type
New Conventional
Purchase Details
Closed on
Jan 14, 2015
Sold by
Ramos Anthony Leroy
Bought by
Ramos Anthony Leroy and Desantiago Mayra
Home Financials for this Owner
Home Financials are based on the most recent Mortgage that was taken out on this home.
Original Mortgage
$7,950
Interest Rate
3.82%
Mortgage Type
Stand Alone Second
Purchase Details
Closed on
Oct 13, 2009
Sold by
Ricks Patrick and Ricks Kathryn
Bought by
Hildebrand Adam R
Home Financials for this Owner
Home Financials are based on the most recent Mortgage that was taken out on this home.
Original Mortgage
$178,703
Interest Rate
5.02%
Mortgage Type
FHA
Purchase Details
Closed on
Nov 9, 2007
Sold by
Black Robert R and Black Kathryn L
Bought by
Ricks Patrick and Ricks Kathryn
Home Financials for this Owner
Home Financials are based on the most recent Mortgage that was taken out on this home.
Original Mortgage
$207,060
Interest Rate
6.35%
Mortgage Type
FHA
Purchase Details
Closed on
Dec 13, 2006
Sold by
Black Marilyn L
Bought by
Black Robert R and Black Kathryn L
Home Financials for this Owner
Home Financials are based on the most recent Mortgage that was taken out on this home.
Original Mortgage
$149,600
Interest Rate
6.32%
Mortgage Type
Purchase Money Mortgage
Purchase Details
Closed on
Apr 26, 2004
Sold by
Oliphant Richard and Oliphant Lillian T
Bought by
Ricks Patrick John
Home Financials for this Owner
Home Financials are based on the most recent Mortgage that was taken out on this home.
Original Mortgage
$143,000
Interest Rate
7.62%
Mortgage Type
Purchase Money Mortgage
Purchase Details
Closed on
Aug 27, 1998
Sold by
Oliphant Richard and Oliphant Lillian T
Bought by
Oliphant Richard and Oliphant Lillian T
Create a Home Valuation Report for This Property
The Home Valuation Report is an in-depth analysis detailing your home's value as well as a comparison with similar homes in the area
Home Values in the Area
Average Home Value in this Area
Purchase History
| Date | Buyer | Sale Price | Title Company |
|---|---|---|---|
| Williams Angelique R | -- | First American Title | |
| Ramos Anthony Leroy | -- | Platinum Title Services | |
| Ramos Anthony L | -- | Platinum Title Services | |
| Ramos Anthony Leroy | -- | North American Title Llc | |
| Ramos Anthony Leroy | -- | Monument Title Ins Co | |
| Hildebrand Adam R | -- | Surety Title | |
| Ricks Patrick | -- | Meridian Title | |
| Black Robert R | -- | None Available | |
| Black Robert R | -- | None Available | |
| Ricks Patrick John | -- | Superior Title | |
| Oliphant Richard | -- | -- |
Source: Public Records
Mortgage History
| Date | Status | Borrower | Loan Amount |
|---|---|---|---|
| Open | Williams Angelique R | $320,000 | |
| Previous Owner | Ramos Anthony L | $192,500 | |
| Previous Owner | Ramos Anthony Leroy | $7,950 | |
| Previous Owner | Hildebrand Adam R | $178,703 | |
| Previous Owner | Ricks Patrick | $207,060 | |
| Previous Owner | Black Robert R | $149,600 | |
| Previous Owner | Black Robert R | $37,400 | |
| Previous Owner | Ricks Patrick John | $143,000 |
Source: Public Records
Tax History
| Year | Tax Paid | Tax Assessment Tax Assessment Total Assessment is a certain percentage of the fair market value that is determined by local assessors to be the total taxable value of land and additions on the property. | Land | Improvement |
|---|---|---|---|---|
| 2025 | $2,490 | $475,900 | $122,100 | $353,800 |
| 2024 | $2,490 | $460,600 | $114,800 | $345,800 |
| 2023 | $2,270 | $418,600 | $109,100 | $309,500 |
| 2022 | $2,404 | $433,000 | $107,000 | $326,000 |
| 2021 | $1,707 | $261,800 | $93,000 | $168,800 |
| 2020 | $1,641 | $237,300 | $75,300 | $162,000 |
| 2019 | $1,566 | $220,700 | $75,300 | $145,400 |
| 2016 | $1,464 | $198,300 | $70,500 | $127,800 |
Source: Public Records
Map
Nearby Homes
- 8732 S 620 E
- 412 E 8760 S
- 8797 Green Way Unit 3
- 807 E Whisper Cove Rd
- 8729 S Leafwood Ln
- 8732 S Oakwood Park Cr
- 8722 S Oakwood Park Cir
- 362 E 9150 S
- 487 E 9270 S
- 9092 Enchanted Oak Ln
- 876 E Chariot Dr
- 270 E 8680 S
- 9218 S Laura Anne Way
- 181 E 9180 S
- 8558 S Center St
- 744 E 8425 S
- 8459 S 300 E
- 220 E Pioneer Ave
- 112 E 8680 S
- 194 Pioneer Ave
- 8963 Mingo Park Dr
- 8953 Mingo Park Dr
- 8975 Mingo Park Dr
- 8975 S Mingo Park Dr
- 8975 S Mingo Park Dr Unit 580
- 8943 Mingo Park Dr
- 564 Mingo View Ave
- 8931 Mingo Park Dr
- 565 Mingo View Ave
- 552 Mingo View Ave
- 553 Mingo View Ave
- 8921 S Mingo Park Dr
- 8921 Mingo Park Dr
- 568 Mingo Park Dr
- 579 Mingo Park Dr
- 554 Mingo Park Dr
- 588 E 9000 S
- 541 E Mingo Ave
- 541 Mingo View Ave
- 541 E Mingo View Ave
Your Personal Tour Guide
Ask me questions while you tour the home.