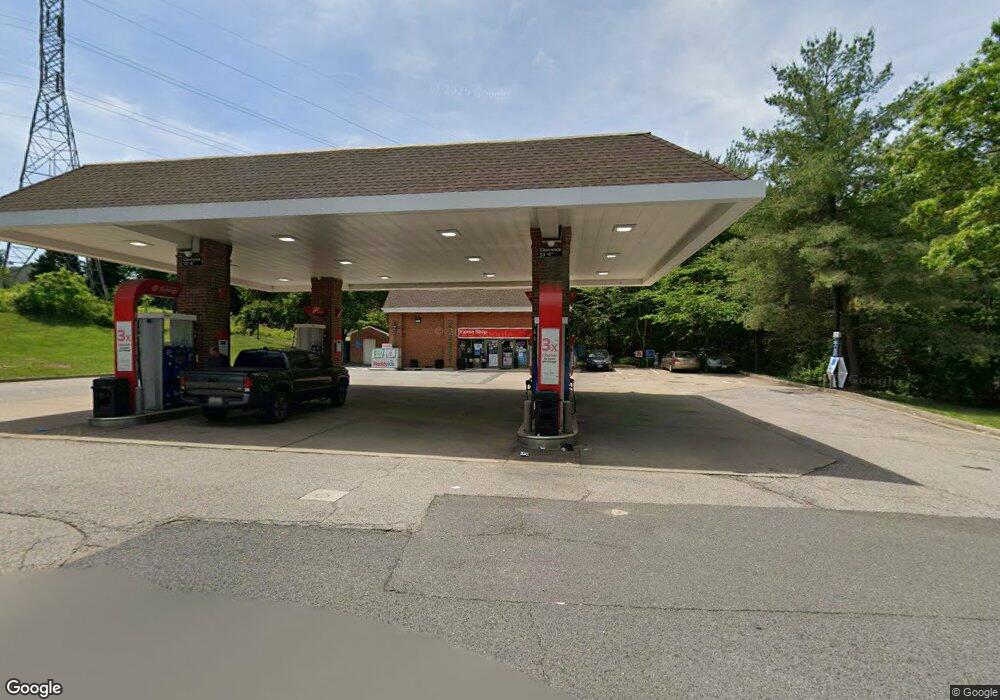
8965 Village Shops Dr Fairfax Station, VA 22039
Crosspointe NeighborhoodEstimated Value: $4,537,106
--
Bed
--
Bath
960
Sq Ft
$4,726/Sq Ft
Est. Value
About This Home
This home is located at 8965 Village Shops Dr, Fairfax Station, VA 22039 and is currently estimated at $4,537,106, approximately $4,726 per square foot. 8965 Village Shops Dr is a home located in Fairfax County with nearby schools including Silverbrook Elementary School, South County Middle School, and South County High School.
Ownership History
Date
Name
Owned For
Owner Type
Purchase Details
Closed on
Jan 2, 2018
Sold by
De Exxon Llc
Bought by
Fairfax Petroleum Realty Llc
Current Estimated Value
Home Financials for this Owner
Home Financials are based on the most recent Mortgage that was taken out on this home.
Original Mortgage
$2,280,000
Outstanding Balance
$1,924,049
Interest Rate
3.94%
Mortgage Type
Commercial
Estimated Equity
$2,613,057
Purchase Details
Closed on
Apr 26, 2017
Sold by
Sun Life Assurance Company Of Canada A C
Bought by
Db Exxon Llc A Virginia Limited Liabilit
Home Financials for this Owner
Home Financials are based on the most recent Mortgage that was taken out on this home.
Original Mortgage
$1,785,000
Interest Rate
4.3%
Mortgage Type
Commercial
Purchase Details
Closed on
May 20, 1999
Sold by
L K T Assocites L C
Bought by
Village Shopes At Crosspointe
Create a Home Valuation Report for This Property
The Home Valuation Report is an in-depth analysis detailing your home's value as well as a comparison with similar homes in the area
Home Values in the Area
Average Home Value in this Area
Purchase History
| Date | Buyer | Sale Price | Title Company |
|---|---|---|---|
| Fairfax Petroleum Realty Llc | $2,925,000 | Commonwealth Land Title | |
| Db Exxon Llc A Virginia Limited Liabilit | $2,100,000 | Attorney | |
| Village Shopes At Crosspointe | $4,560,000 | -- |
Source: Public Records
Mortgage History
| Date | Status | Borrower | Loan Amount |
|---|---|---|---|
| Open | Fairfax Petroleum Realty Llc | $2,280,000 | |
| Previous Owner | Db Exxon Llc A Virginia Limited Liabilit | $1,785,000 |
Source: Public Records
Tax History Compared to Growth
Tax History
| Year | Tax Paid | Tax Assessment Tax Assessment Total Assessment is a certain percentage of the fair market value that is determined by local assessors to be the total taxable value of land and additions on the property. | Land | Improvement |
|---|---|---|---|---|
| 2025 | $17,288 | $1,372,540 | $646,350 | $726,190 |
| 2024 | $17,288 | $1,346,970 | $646,350 | $700,620 |
| 2023 | $14,614 | $1,165,820 | $544,300 | $621,520 |
| 2022 | $14,641 | $1,154,170 | $544,300 | $609,870 |
| 2021 | $14,888 | $1,146,520 | $544,300 | $602,220 |
| 2020 | $15,708 | $1,200,430 | $510,280 | $690,150 |
| 2019 | $15,354 | $1,173,370 | $510,280 | $663,090 |
| 2018 | $13,070 | $1,136,520 | $510,280 | $626,240 |
| 2017 | $15,400 | $1,197,520 | $810,000 | $387,520 |
| 2016 | $15,368 | $1,197,360 | $810,000 | $387,360 |
| 2015 | $13,764 | $1,109,110 | $720,000 | $389,110 |
| 2014 | $12,608 | $1,017,970 | $630,000 | $387,970 |
Source: Public Records
Map
Nearby Homes
- 8521 Century Oak Ct
- 8625 Oak Chase Cir
- The Grant Plan at Southern Oaks Reserve
- The Taylor Plan at Southern Oaks Reserve
- 8757 Southern Oaks Place
- 8761 Southern Oaks Place
- 8603 Rocky Gap Ct
- 8560 Koluder Ct
- 8542 Blue Rock Ln
- 8011 Treasure Tree Ct
- 8504 Blue Rock Ln
- 8503 Bertsky Ln
- 8622 Cross Chase Ct
- 8431 Ambrose Ct
- 8110 Winter Blue Ct
- 8703 Flowering Dogwood Ln
- 8834 Ox Rd
- 8153 Old Barrington Blvd
- 8811 Ox Rd
- 9596 Oakington Dr
- 8975 Village Shops Dr
- 8657 Oak Chase Cir
- 8900 Village Shops Dr
- 8655 Oak Chase Cir
- 8656 Oak Chase Cir
- 8651 Oak Chase Cir
- 0 Emma Ann Way Unit 1006365896
- Emma Ann Way
- 8503 Oak Pointe Way
- 8654 Oak Chase Cir
- 9027 Copperleaf Ln
- 9025 Copperleaf Ln
- 8649 Oak Chase Cir
- 9021 Copperleaf Ln
- 9019 Copperleaf Ln
- 8502 Century Oak Ct
- 9029 Copperleaf Ln
- 9017 Copperleaf Ln
- 9015 Copperleaf Ln
- 9031 Copperleaf Ln