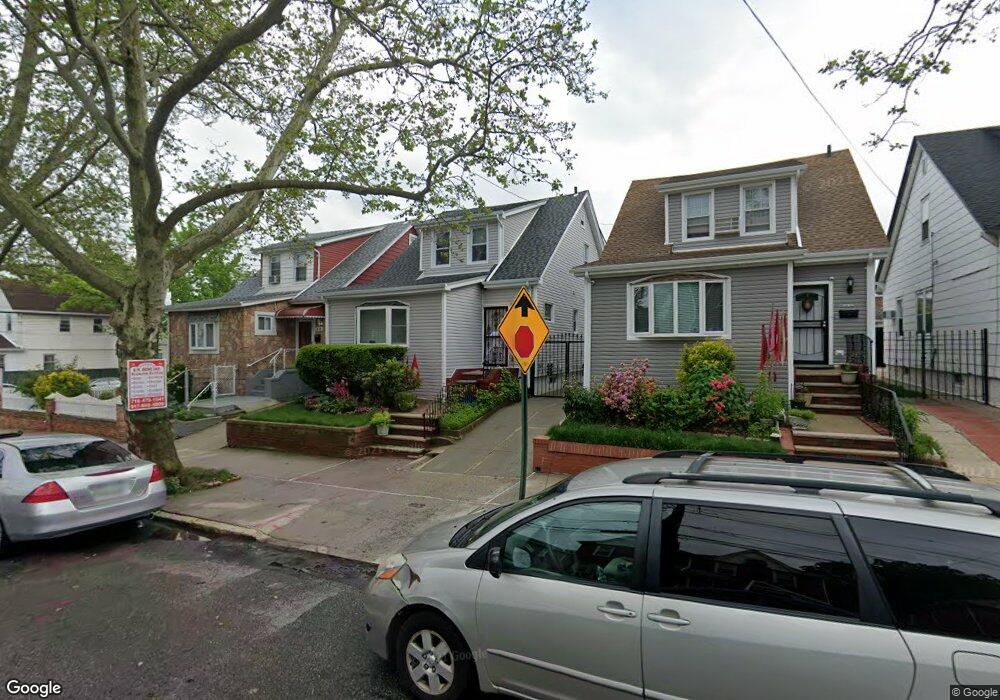
8966 209th St Queens Village, NY 11427
Queens Village NeighborhoodEstimated Value: $813,000 - $1,008,000
--
Bed
--
Bath
2,164
Sq Ft
$424/Sq Ft
Est. Value
About This Home
This home is located at 8966 209th St, Queens Village, NY 11427 and is currently estimated at $917,006, approximately $423 per square foot. 8966 209th St is a home located in Queens County with nearby schools including The Bellaire School, Jean Nuzzi Intermediate School, and Incarnation Catholic Academy.
Ownership History
Date
Name
Owned For
Owner Type
Purchase Details
Closed on
Dec 8, 2022
Sold by
Parbhudial Bhojkumar and Parbhudial Nadira
Bought by
Savitri Sookram Trustee and The Parbhudial Family Trust
Current Estimated Value
Purchase Details
Closed on
Feb 13, 2010
Sold by
Parbhudial Bhojkumar and Parbhudial Pramod
Bought by
Parbhudial Bhojkumar and Parbhudial Nadira
Purchase Details
Closed on
Aug 2, 2000
Sold by
Parbhudial and Parbhudial Tampawati
Bought by
Parbhudial Bhojkumar and Parbhudial Pramod
Purchase Details
Closed on
Nov 16, 1995
Sold by
Danese Paula and Bilello Gasper
Bought by
Parbhudial Hiamwattie and Parbhudial Bhojkumar
Home Financials for this Owner
Home Financials are based on the most recent Mortgage that was taken out on this home.
Original Mortgage
$100,000
Interest Rate
7.04%
Mortgage Type
Purchase Money Mortgage
Create a Home Valuation Report for This Property
The Home Valuation Report is an in-depth analysis detailing your home's value as well as a comparison with similar homes in the area
Home Values in the Area
Average Home Value in this Area
Purchase History
| Date | Buyer | Sale Price | Title Company |
|---|---|---|---|
| Savitri Sookram Trustee | -- | -- | |
| Savitri Sookram Trustee | -- | -- | |
| Parbhudial Bhojkumar | -- | -- | |
| Parbhudial Bhojkumar | -- | -- | |
| Parbhudial Bhojkumar | -- | Fidelity National Title Ins | |
| Parbhudial Bhojkumar | -- | Fidelity National Title Ins | |
| Parbhudial Hiamwattie | $149,500 | First American Title Ins Co | |
| Parbhudial Hiamwattie | $149,500 | First American Title Ins Co |
Source: Public Records
Mortgage History
| Date | Status | Borrower | Loan Amount |
|---|---|---|---|
| Previous Owner | Parbhudial Hiamwattie | $100,000 |
Source: Public Records
Tax History Compared to Growth
Tax History
| Year | Tax Paid | Tax Assessment Tax Assessment Total Assessment is a certain percentage of the fair market value that is determined by local assessors to be the total taxable value of land and additions on the property. | Land | Improvement |
|---|---|---|---|---|
| 2025 | $7,417 | $38,756 | $11,364 | $27,392 |
| 2024 | $7,417 | $36,926 | $11,097 | $25,829 |
| 2023 | $7,072 | $35,209 | $9,942 | $25,267 |
| 2022 | $6,888 | $55,020 | $17,400 | $37,620 |
| 2021 | $6,771 | $47,340 | $17,400 | $29,940 |
| 2020 | $6,836 | $45,360 | $17,400 | $27,960 |
| 2019 | $6,437 | $42,120 | $17,400 | $24,720 |
| 2018 | $5,981 | $29,341 | $12,587 | $16,754 |
| 2017 | $5,762 | $28,264 | $13,156 | $15,108 |
| 2016 | $5,485 | $28,264 | $13,156 | $15,108 |
| 2015 | $3,216 | $26,914 | $18,840 | $8,074 |
| 2014 | $3,216 | $25,644 | $15,263 | $10,381 |
Source: Public Records
Map
Nearby Homes
- 9013 209th St
- 8935 210th Place
- 89-28 207th St
- 90-60 209th St
- 90-54 209th St
- 90-32 207th St
- 90-13 Francis Lewis Blvd
- 90-36 Francis Lewis Blvd
- 88-21 208th St
- 9022 Hollis Court Blvd
- 8919 205th St
- 9331 207th St
- 88-20 Hollis Court Blvd
- 88-12 Francis Lewis Blvd
- 21014 Hillside Ave
- 89-38 212th St
- 9353 207th St
- 88-52 212th St
- 8821 Hollis Court Blvd
- 91-03 212th St