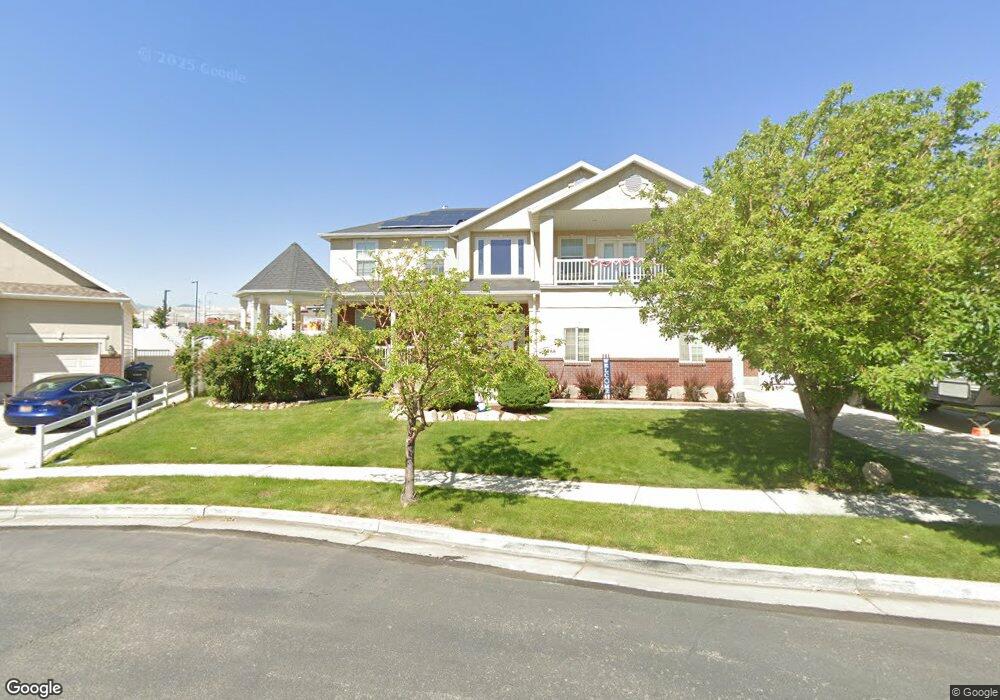
8966 S Philadelphian Ct West Jordan, UT 84081
Copper Hills NeighborhoodEstimated Value: $706,210 - $751,000
6
Beds
4
Baths
3,739
Sq Ft
$196/Sq Ft
Est. Value
About This Home
This home is located at 8966 S Philadelphian Ct, West Jordan, UT 84081 and is currently estimated at $734,553, approximately $196 per square foot. 8966 S Philadelphian Ct is a home located in Salt Lake County with nearby schools including Copper Canyon School, West Hills Middle School, and Copper Hills High School.
Ownership History
Date
Name
Owned For
Owner Type
Purchase Details
Closed on
Apr 7, 2022
Sold by
Ngoc Tran Huong
Bought by
Cochran Jarrod Carl and Cochran Margaret Patricia
Current Estimated Value
Home Financials for this Owner
Home Financials are based on the most recent Mortgage that was taken out on this home.
Original Mortgage
$568,000
Outstanding Balance
$536,098
Interest Rate
4.72%
Mortgage Type
New Conventional
Estimated Equity
$198,455
Purchase Details
Closed on
Jun 18, 2014
Sold by
Ngo Peter
Bought by
Tran Huong Ngoc and Cao Tinh Huu
Purchase Details
Closed on
Dec 23, 2008
Sold by
45 55 Association Llc
Bought by
Mountain America Federal Credit Union
Purchase Details
Closed on
Jan 10, 2008
Sold by
Ngo Peter and Ngo Tu Phan Nhat
Bought by
Ngo Peter
Home Financials for this Owner
Home Financials are based on the most recent Mortgage that was taken out on this home.
Original Mortgage
$263,500
Interest Rate
6.05%
Mortgage Type
New Conventional
Purchase Details
Closed on
Dec 21, 2005
Sold by
Ngo Peter and Ngo Tu Phan Nhat
Bought by
Ngo Peter and Ngo Tu Phan Nhat
Home Financials for this Owner
Home Financials are based on the most recent Mortgage that was taken out on this home.
Original Mortgage
$65,200
Interest Rate
6.35%
Mortgage Type
Stand Alone Second
Purchase Details
Closed on
Dec 20, 2005
Sold by
Klawe Noel A and Klawe Ladeane R
Bought by
Ngo Peter and Ngo Tu Phan Nhat
Home Financials for this Owner
Home Financials are based on the most recent Mortgage that was taken out on this home.
Original Mortgage
$65,200
Interest Rate
6.35%
Mortgage Type
Stand Alone Second
Purchase Details
Closed on
Aug 26, 2004
Sold by
Klawe Noel A
Bought by
Klawe Noel A and Klawe Ladeane R
Home Financials for this Owner
Home Financials are based on the most recent Mortgage that was taken out on this home.
Original Mortgage
$55,400
Interest Rate
5.95%
Mortgage Type
Credit Line Revolving
Purchase Details
Closed on
Jan 21, 2004
Sold by
Klawe Noel A
Bought by
Klawe Noel A and Klawe Ladeane R
Purchase Details
Closed on
Sep 2, 2003
Sold by
Rochelle Investments Llc
Bought by
Klawe Noel A
Home Financials for this Owner
Home Financials are based on the most recent Mortgage that was taken out on this home.
Original Mortgage
$214,457
Interest Rate
5.87%
Mortgage Type
Purchase Money Mortgage
Create a Home Valuation Report for This Property
The Home Valuation Report is an in-depth analysis detailing your home's value as well as a comparison with similar homes in the area
Home Values in the Area
Average Home Value in this Area
Purchase History
| Date | Buyer | Sale Price | Title Company |
|---|---|---|---|
| Cochran Jarrod Carl | -- | Investors Title | |
| Tran Huong Ngoc | -- | Metro National Title | |
| Mountain America Federal Credit Union | -- | Merrill Title | |
| Ngo Peter | -- | Cottonwood Title | |
| Ngo Peter | -- | Inwest Title Services | |
| Ngo Peter | -- | Inwest Title Services | |
| Klawe Noel A | -- | Backman Stewart Title Svcs | |
| Klawe Noel A | -- | Backman Stewart Title Svcs | |
| Klawe Noel A | -- | -- | |
| Klawe Noel A | -- | Merrill Title |
Source: Public Records
Mortgage History
| Date | Status | Borrower | Loan Amount |
|---|---|---|---|
| Open | Cochran Jarrod Carl | $568,000 | |
| Previous Owner | Ngo Peter | $263,500 | |
| Previous Owner | Ngo Peter | $65,200 | |
| Previous Owner | Ngo Peter | $260,800 | |
| Previous Owner | Klawe Noel A | $55,400 | |
| Previous Owner | Klawe Noel A | $214,457 | |
| Closed | Klawe Noel A | $34,000 |
Source: Public Records
Tax History Compared to Growth
Tax History
| Year | Tax Paid | Tax Assessment Tax Assessment Total Assessment is a certain percentage of the fair market value that is determined by local assessors to be the total taxable value of land and additions on the property. | Land | Improvement |
|---|---|---|---|---|
| 2025 | $3,650 | $707,800 | $166,800 | $541,000 |
| 2024 | $3,650 | $702,300 | $165,100 | $537,200 |
| 2023 | $3,670 | $665,400 | $155,700 | $509,700 |
| 2022 | $3,410 | $608,300 | $152,700 | $455,600 |
| 2021 | $2,882 | $468,000 | $118,700 | $349,300 |
| 2020 | $2,694 | $410,500 | $118,700 | $291,800 |
| 2019 | $2,661 | $397,700 | $112,000 | $285,700 |
| 2018 | $2,527 | $374,600 | $112,000 | $262,600 |
| 2017 | $2,370 | $349,800 | $112,000 | $237,800 |
| 2016 | $2,281 | $316,300 | $112,000 | $204,300 |
| 2015 | $2,193 | $296,500 | $118,400 | $178,100 |
| 2014 | $2,016 | $268,400 | $108,800 | $159,600 |
Source: Public Records
Map
Nearby Homes
- 8793 S Big Bar Ct
- 5582 Washoe Cove
- 8854 Rocky Creek Dr
- 9118 S Wisteria Way
- 5098 Cherry Laurel Ln
- 8453 S Windmill Dr
- 7214 S Sage Run Rd
- 8577 Autumn Gold Cir
- 8441 S Spratling Dr
- 8501 S Michele River Ave
- 8501 S Michele River Ave Unit 116
- 5946 W Eric Mountain Ln Unit 103
- 5946 W Eric Mountain Ln
- 5958 W Eric Mountain Ln
- 5958 W Eric Mountain Ln Unit 104
- Larsen Plan at Copperhaven by Toll Brothers
- Brooke Plan at Copperhaven by Toll Brothers
- 8524 S Michele River Ave
- 9332 S Wild Clover Ln
- 6222 W Swan Ridge Way
- 8966 Philadelphian Ct
- 8954 S Philadelphian Ct
- 8954 Philadelphian Ct
- 5529 Philadelphian Ct
- 5529 W Philadelphian Ct
- 5519 Philadelphian Ct
- 5519 W Philadelphian Ct
- 8959 S Philadelphian Ct
- 8959 Philadelphian Ct
- 8942 Philadelphian Ct
- 8947 Philadelphian Ct
- 8947 S Philadelphian Ct
- 5507 Philadelphian Ct
- 8941 Philadelphian Ct
- 5547 Adamson Cir
- 5547 W Adamson Cir
- 5559 Adamson Cir
- 8952 Copperwood Dr
- 8952 S Copperwood Dr
- 8938 S Copperwood Dr